Crossing Domain Boundaries

After an RF or microwave signal has been converted to an intermediate frequency (IF) and digitized, the type of signal processing you choose to apply determines what information is extracted from the raw data. Traditionally, signals were defined as a spectrum in the frequency domain or a waveform in the time domain.
Neither of these representations is adequate when the information content is related to the signal’s variation with time. By the 1980s, modulation analyzers and time interval analyzers (TIA) had been developed to better address time-varying parameters.
More recently, vector signal analyzers (VSA) have provided measurements such as error vector magnitude and error vector time associated with complex digital modulation schemes. Code-domain power measurements are necessary to describe CDMA operation. In addition, complementary cumulative distribution function (CCDF) displays help designers understand the statistical peak-to-average power ratio of the signals their amplifiers are handling.
Ben Zarlingo, product manager at Agilent Technologies, described how his company has dealt with continuing growth in the number and type of measurement domains. “For Agilent, the user interface complexity associated with these many measurements and domains was a factor in changing the VSA from a stand-alone instrument to a software application that could work with many spectrum and signal analyzers,” he said. “The measurement domains of the 89600 VSA software now are applicable to signal data harvested by logic analyzers, RF/microwave signals sampled directly by oscilloscopes, and data samples from simulation programs.”
National Instruments (NI) also produces a wide range of hardware instruments as well as the LabVIEW graphical test software language. In a PXI test system, the specific role played by the various modules is defined in software.
David Hall, senior product marketing manager for RF and wireless test, said, “PXI-based digitizers give users access to the sampled data and enable signals to be analyzed through a broad range of signal-processing routines. In addition to performing frequency-domain and joint time-domain analysis, you can use the LabVIEW digital downconversion subroutine to produce a baseband IQ waveform, which enables analysis in the complex domain. In essence, any signal processing done with an RF VSA also can be accomplished using a high-speed digitizer.”
Product design decisions may be different for more specialized companies. Often, a single instrument provides a group of capabilities needed to test certain technologies. For example, Anritsu’s MS2830A Signal Analyzer combines both signal analysis and generation for frequencies as high as 43 GHz.
The company’s Hiroshi Goto, product specialist, confirmed, “The MS2830A is a single instrument that combines the functionality of separate test boxes. This is a major advantage. It has been developed as a flexible, scalable instrument with capabilities of a spectrum analyzer, a signal analyzer, and a vector signal generator (VSG),” he concluded. Anritsu focuses on optical, RF, and microwave test equipment.
Tektronix makes real-time signal analyzers (RSA) and logic and protocol analyzers and is the market leader in oscilloscopes. The company recently launched the MDO4000 Multi-Domain Oscilloscope that combines four analog and 16 digital channels together with one RF channel. Although not unique to Tektronix, the time-correlated display is a very important feature in this instrument as well as in the company’s analyzers.
As explained by Darren McCarthy, technical marketing manager for RF Test at the company, “MDO4000 Series Scopes enable you to view time-correlated displays of protocol, state logic, analog, and RF signals within an embedded design.
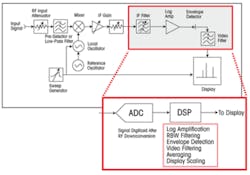
Figure 1. Modern Signal Analyzer Architecture
Courtesy of Agilent Technologies
“The RSAs not only enable real-time spectrum viewing, but also real-time analysis for amplitude, frequency, and phase vs. time that helps identify the effects of microphonics, fan noise, or motor vibrations,” Mr. McCarthy continued. “In addition to the traditional time, frequency, and modulation domain analysis capabilities, the statistical and code domains provide the necessary information to help you truly analyze signal behavior.”
VSA Architecture
As shown in Figure 1, Agilent’s VSA architecture begins with normal swept superheterodyne downconversion used in conventional spectrum analyzers and network analyzers but with a wide IF bandwidth. Mr. Zarlingo elaborated, “With modern DSP, any type of analysis, domain, or display can be implemented from the data produced from the digital IF. This is essential to meet the needs of fast-evolving modulation/communications technology along with other applications such as imaging including radar and microwave vision.”
Accuracy
“Accuracy is improved with this approach,” he explained, “because operations such as log amplification and scaling can be done entirely through mathematical operations. Speed is improved because of the predictable dynamics of digital resolution bandwidth (RBW) filters, which can be swept several times faster than analog filters and still produce more accurate results. These filters also are more selective than analog filters, with a shape factor 3x or 4x better.”
According to Anritsu’s Mr. Goto, “The MS2830A architecture incorporates an electronic attenuator with advanced CMOS technology that can handle up to 6 GHz as well as a low-loss GaAs switch to support high levels and a wide dynamic range of 168 dB. Anritsu also has designed a built-in calibrator with amplitude/phase correction circuits that automatically reduces internal error to provide total level accuracy of typically ±0.3 dB from 300 kHz to 4 GHz.
“Better accuracy and a large dynamic range improve production yield by eliminating false negative evaluation errors when conducting distortion and spurious measurements,” he concluded. “DSP and FFT techniques have been included that reduce spurious measurement times to improve manufacturing and adjustment throughput.”
Data Volume
Sometimes, virtually unlimited amounts of data must be captured if an intermittent fault cannot be accurately predicted. However, most box instruments are limited by the amount of available memory. This is an area in which NI’s newer PXIe modules such as the PXIe-5665 VSA excel, having the capability to stream terabytes of data at speeds of at least 300 MB/s.
The company’s Mr. Hall explained, “Often, engineers will record extended waveforms and then analyze them segment by segment, looking at both the time and frequency domains. This type of analysis enables them to identify intermittent signals as well as utilize highly customized signal processing routines.”
Display
“To view the frequency domain, a complex FFT is performed on the IQ sample set, producing a frequency domain representation similar to a traditional spectrum analyzer,” he concluded. “The same set of samples can be visualized in the joint time-frequency domain through the use of the Gabor spectrogram. The Gabor spectrogram essentially produces a waterfall display where time and frequency are the X and Y axes, respectively, and power is denoted by color intensity.”
Color intensity or intensity grading has become a popular display method, especially when a large amount of data is involved. When describing the display technology used in GW Instek’s new GSP-930 3-GHz Spectrum Analyzer, Anderson Kuan, the project manager on the GSP-930, made the distinction between showing only the original data points and showing the points plus linear connecting lines. Sometimes this is called linear interpolation or dot joining, but on today’s pixel-mapped screens, only vertical line segments are used.
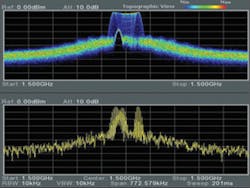
Figure 2. (a) Topographical Display Mode; (b) Conventional Dot-Joined Display Mode
Courtesy of Instek America
Adding lines helps a great deal when viewing simple waveforms. For example, square waves actually have vertical edges because of this kind of interpolation. But, what about very active spectra? In that case, the image contains many vertical lines and is quite different from the traditional spectrum analyzer display capable of vector dot joining at any angle.
According to Mr. Kuan, the company developed the topographic display mode to more accurately represent the signal activity. Figure 2 compares a topographic image (a) with a typical vertical dot-joined display (b).
From the topographic view, you can easily see that the noise is concentrated near the center of the band. Also, there is a constant frequency but weak signal apparent within the FM frequency deviation range. Because the amount of information available in any one acquisition is limited, the dot-joined image only can show a snapshot of signal activity. It cannot show it in relation to other acquisitions. If you try to overlay traces, the dot joining obliterates detail.
Rohde & Schwarz (R&S) entered the real-time spectrum analyzer market in 2011 with the Model FSVR. It has a 40-MHz real-time analysis bandwidth and is available with the 7-, 13.6-, 30-, and 40-GHz frequency range. The IF output is sampled at up to 128-MS/s, and up to 250,000 FFTs/s are performed.
The resulting display of so much accumulated data is refreshed at a 30-Hz rate and can be presented in what R&S calls a persistence mode. Much like Instek’s topographical mode, the R&S display uses color to indicate how often a signal occurred at a specific frequency and level. The company also refers to this display mode as a spectral histogram.
Oscilloscope Architecture
Long Acquisitions
In general, oscilloscope sampling speed and bandwidth have kept up with higher communications systems data rates. However, when a scope samples more quickly, a larger memory is needed to store a waveform than if it were sampled more slowly. The consequence of measuring the time between an event on a slow I2C bus and a high-speed digital visual interface (DVI) signal, for example, could be a 50-Mpoint acquisition.
Manipulating very long data files can drastically slow down an instrument. The X-Stream II technology is one of the fast processing techniques LeCroy has developed. X-Stream technology optimizes how the Intel Core™ 2 Quad 64-b microprocessor used in the company’s latest series scopes is applied to long acquisitions by minimizing the number of times the cache reads or writes to main memory.1
As Ken Johnson, LeCroy’s product marketing manager for high-speed products, explained, “In frequency-domain applications, the resolution of the FFT and spectral analysis is directly related to the number of points—the length of the acquisition. If you are evaluating periodic jitter, then any very low-frequency periodicity will be apparent with a longer acquisition. Longer acquisitions also make longer PRBS pattern analysis possible, which means that more low-frequency events and jitter related to longer PRBS patterns can be quantified.”
LeCroy scopes process mathematically manipulated traces in the same way as acquired waveforms. This means that you can chain operations to generate custom domain views.
For example, LeCroy calls the display of successive periods of a clock waveform a trend plot. If the trend plot is resampled to be time synchronous with the source trace, the resulting waveform shows how the clock period varies with time. However, because the resampled plot is time synchronous, an FFT or any other processing operation can be performed that ordinarily would be applied to an acquired trace.
Time Correlation
In the Model MDO4000 Oscilloscope, Tektronix has emphasized time-correlated cross-domain displays. The patent-pending Spectrum Time feature is unique and a good example of how you can relate the time- and frequency-domain views. The Spectrum Time window selects that portion of the time-domain waveform for which the corresponding RF spectrum is displayed. As you slide the window through the waveform, the spectrum updates. This makes it easy to see the amount of EMI reduction accomplished by changing the order in which a control sequence executes.
In addition, as the company’s Mr. McCarthy explained, “The mixed-domain capabilities of the Tektronix MDO4000 support triggering on any one of the 21 inputs or logical combinations including protocol command level. This triggering resource extends to directly triggering on time-qualified RF events including RF pulse widths, runts, and sequences, a capability also found in the RSAs.”
Extended Frequency Range
Just as signal analyzer frequencies are increasing, so too are those for DSOs. Although most scope manufacturers have adopted various generations of SiGe technology for the analog input circuitry, there are exceptions. Agilent Technologies has opted for an indium phosphide (InP) approach that supports 32-GHz bandwidth in the company’s Infiniium 90000 X-Series scopes.
Several scope companies have developed bandwidth-boosting technology that extends the natural frequency range by 10% or 20%. For example, bandwidth enhancement is used in the Tektronix DPO/DSA/MSO72004C Oscilloscope to provide 20-GHz bandwidth. The basic hardware typically provides 16 GHz.
However, oscilloscope amplifiers must maintain a high-fidelity pulse shape, which implies that the amplifier rolloff is relatively gentle. To enhance bandwidth through DSP techniques, it is not just the response at the band limit that must be lifted, but also the higher frequencies that contribute to the pulse shape. Bandwidth boosting is useful but generally adds noise.
Yet another method has been developed by LeCroy called bandwidth interleaving. In this approach, the input signal is split into frequency bands, each of which is amplified and digitized, and the digital results stitched back together to represent a composite signal. Obviously, it is not easy to maintain good pulse response and avoid added aberrations. However, the technology is in its sixth generation and used in several of the company’s high-frequency scopes, the most recent being the WaveMaster 8 Zi-A with a 45-GHz bandwidth. The company claims that this technique always can leapfrog an available semiconductor technology’s bandwidth limitations.
Summary
Today’s high-frequency signal analyzers achieve good performance by optimizing both the analog front end and the digital back end. Many company representatives have commented that virtually any display can be created by DSP although the mix of software and digital hardware varies with the manufacturer.
Each manufacturer has a range of instruments from which you can narrow the choice to those few that meet your technical requirements and fit within your budget. Beyond that, however, many vendor-specific nuances complicate the selection process.
Reference
1. Pupalaikis, P. J., “X-Stream II,” LeCroy, Technical Brief, September 2010.
| FOR MORE INFORMATION | CLICK HERE | |
| Agilent Technologies | 89600 VSA Software | CLICK HERE |
| Anritsu | MS2830A | CLICK HERE |
| Instek America | GSP-930 | CLICK HERE |
| LeCroy | WaveMaster 8 Zi-A | CLICK HERE |
| National Instruments | PXIe-5665 | CLICK HERE |
| Rohde & Schwarz | FSVR | CLICK HERE |
| Tektronix | MDO4000 | CLICK HERE |
About the Author
Comment About the Article
To join the conversation, and become an exclusive member of Electronic Design, create an account today!

Leaders relevant to this article: