Ensuring That Smart Power Really Is

The continuing emphasis on smart power has increased the importance of power meters, monitors, and analyzers. They all measure rms voltage, current, and power but differ in how and where they are used as well as in the additional functions each provides.
Typically, the term analyzer implies that you can examine power in more detail, which usually means there is something special about the instrument hardware. You might require a fast sampling rate and wide bandwidth if the higher harmonics in a pulse-width modulated (PWM) motor drive are important. Or, capturing up to the 50th harmonic of the basic 60-Hz power frequency could be fine if there also is a sensitive current range to determine low values of standby power.
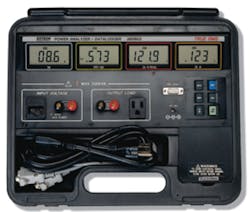
Courtesy of Extech Instruments
In the case of the 3.6-lb portable Extech Instruments’ Model 380803 Appliance Tester/Power Analyzer shown in Figure 1, plugging the DUT into the power analyzer completes the test setup. Four separate displays simultaneously provide watts, power factor or VA, voltage or frequency, and amps. The true rms measurements are updated every 400 ms, and computations include phase angle, apparent and reactive power, consumption and cost, and power factor correction.
Although power monitoring may measure several quantities, the key activity is datalogging. If an unattended process shuts down at random times for no obvious reason, recording the power excursions outside of a normal operating range could pinpoint the problem. The measurement of time-related effects generally differentiates a monitor from a meter although there is a lot of overlap among categories. Extech’s Model 380801 can acquire data if connected to a PC. Model 380803 makes all the same measurements but also stores up to 1,012 readings.
Fluke breaks down these top-level definitions into several more specialized designations. A power quality logger can capture hard-to-find voltage events over a user-specified time period. A power quality recorder offers more features than a logger and provides comprehensive power disturbance details, trend analysis, and QoS compliance testing.
On Fluke’s Power Quality Solution Center web page, the question is asked, “Why should I use Fluke power meters?”. The answer simply confirms the need to make sure you have the required functionality to address the application at hand regardless of what the tool is called. Unlike the single-function products, Fluke reported, its power meter is a power monitor, an AC power meter, and a power factor meter.
As that response implies, a power meter can be limited to just reading the total power used, but most are much more comprehensive. Also, a meter may be built into an industrial control panel where generally an analyzer would not be. Monitors fall in between. Some applications require periodic monitoring and have built-in connectors at many locations to facilitate making simple and safe connections. If only a few locations must be monitored, it might make sense to build in the monitors.
Ametek Power Instruments’ power and quality recorder features four current and four voltage inputs, a frequency response from 40 to 3,000 Hz, and a 128-sample/cycle rate. Clearly, the sample rate suits the intended AC mains supply monitoring application and is not appropriate for fast motor-drive PWM signals or high-frequency fluorescent lighting ballasts.
This type of recorder has an internal hard disk to store data measured over a period as long as 16 weeks. Up to 2 s of transient data can be stored as an event—about 14,000 samples. Similarly, the rms and phasor measurements associated with a disturbance lasting up to a minute can be recorded at 2-samples/cycle resolution. Trends are logged each minute as maximum, minimum, and average values.
Power Analyzer Characteristics
Several variables influence how well a specific analyzer matches an application.
Number of Signals
A single-phase application requires one voltage and one current. Some analyzers extend this minimal set of inputs by adding speed and torque inputs so that a motor’s efficiency can be measured. The number of measurements that simultaneously can be displayed also is important, a graphical LCD being much more flexible than a single-quantity numeric readout.
Voltech Instruments makes a range of power analyzers, the latest one being the PM1000+ that combines single-phase economy with many of the analysis capabilities of the higher price models. With a voltage input rated at ±900 Vpk or 600 V rms and current at ±100 A or 20 A rms, most residential and many industrial loads can be handled.
The basic voltage and current accuracies are ±0.05% of reading ±0.05% of range. Special built-in application operating modes configure the analyzer for HF lighting ballast output, inrush current, low-power standby, or energy integrator measurements. The precompliance IEC 61000-3-2/3 harmonics and flicker mode is available as an option.
A three-phase application needs two or three power meters depending on whether three or four wires are involved. In a three-wire delta-connected system, voltages are measured between phase 1 and 3 and between phase 2 and 3. Currents are measured in phases 1 and 2. Two power readings are calculated from the two sets of V and I, and the total power is the sum of the two readings.
In a four-wire wye-connected system, three wattmeters measure the power associated with each phase, and voltages are referred to neutral. Three meters also can be used for a three-wire system with the advantage of having a separate display for each phase.
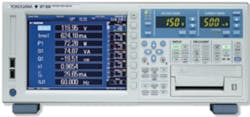
Courtesy of Yokogawa Corp. of America
Yokogawa’s WT1800, shown in Figure 2, uses as many as six independent elements, which support two three-phase or up to six separate single-phase measurements. Similarly, Voltech Instruments’ PM6000 also has a maximum of six elements with fully floating inputs. You can configure them as needed, for example as one AC input and five DC outputs or three-phase input and output. Mixing input and output power is particularly useful because these analyzers can compute efficiency.
Voltage and Current Level
AC power applications traditionally have scaled voltages and currents via instrument transformers to accommodate the input ranges on measuring equipment. ABB and other manufacturers make these specialized transformers to strict performance standards.
As noted in an ABB application guide, “Voltage transformers are designed so the through impedance (Rs, Rp, Xp, and X) is as low as possible while current transformers are designed so the excitation impedance (Zo and Zi) is as high as possible. Neither transformer is very good at performing the function of the other.”1 (Rs = secondary resistance, Rp = primary resistance, Xp = primary reactance, X = reactance caused by the leakage flux, and Zo and Zi = shunt excitation impedances.)
Transformers are accurate, robust, and passive and generally have very long service lives. However, certain errors are associated with their use. Voltage transformers state a ratio on the nameplate to indicate the nominal ratio such as 20:1. Both amplitude and phase errors are grouped into a ratio correction factor defined in IEEE C57.13.
All instrument transformers are designed to achieve the stated accuracy with a particular burden—the load presented by the measuring instrument connected to the secondary. Nevertheless, very high voltages and currents can be accommodated, and the ABB reference describes several proven insulation systems and construction methods.
Transformers are useful within a relatively small range of frequencies: 45 Hz to 1,000 Hz for the CT1000 Current Transformer sold as an accessory for Voltech’s analyzers. This transformer has less than a 0.2% ratio error and 0.1-degree phase error at 50 Hz. It provides outputs for both 100:1 and 1,000:1 scaling and accepts cables to 45-mm dia and bussbars to 51 mm x 30 mm or 64 mm x 13 mm.
The CT1000 also contains special output limiting circuitry, something not found in a basic current transformer. Current transformers can be very dangerous because there is a high turns ratio between the input, typically a single turn, and the output. If the burden becomes disconnected, the output voltage can rise to lethal levels. The CT1000 clamps the output at 50 V, well above the normal 0.15-VA burden level so measurements are not affected but low enough to avoid operator injury.
Frequency and Accuracy
In addition to transformers, resistive voltage dividers, current sensing resistors, and current sensing Rogowski coils commonly are used. They have the advantages of wide bandwidth and no saturation effects. Rogowski coils are particularly attractive for fieldwork because many models do not require the current path to be broken as is necessary to connect a current transformer primary.
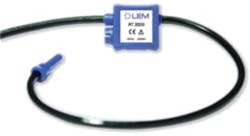
Courtesy of LEM
LEM Energy and Automation recently released the RT series of Rogowski Coils with improved characteristics (Figure 3). Although a Rogowski coil is conceptually simple, three major weaknesses limit the degree to which its accuracy approaches theoretical levels. The winding density and the coil cross section must be uniform. In practice, these mechanical factors only can be minimized, and LEM did so by developing new manufacturing techniques to wind the coils.
A much larger effect was the discontinuity at the joint made when the loop is closed. This has been almost completely eliminated by making the coil clasp from magnetic material. Measurements confirm that rather than the conventional discontinuity, the magnetic reluctance short-circuit makes the joint appear to be continuous. In fact, the solution has been so successful that second-order problems related to the winding itself became more obvious.
Resistive dividers appear to be straightforward but have their own particular problems. Among these is the voltage coefficient of the resistive material. Especially for high value resistances, the value changes with temperature as well as in response to the voltage across the resistor. Some voltmeter inputs have a few resistors in series to reduce the voltage across each one.
Having a lower maximum voltage across a resistor improves accuracy in two ways. As an example, consider dividing the input voltage by using three resistors each with one-third the value of a single one. The total resistance change caused by the voltage coefficient of resistance will be 3x smaller than if a single resistor were used having the same coefficient. The total power dissipation will be the same with one or three resistors, but the temperature change in each of the three could be lower if they were physically similar in size to the single one, resulting in a smaller change attributable to the temperature coefficient.
To measure currents at DC, you are limited to Hall effect current sensing or a resistive shunt. If the measurement must extend over a wide bandwidth and include DC, accuracy may suffer.
One way to improve performance is to combine a DC Hall effect transducer with an AC current transformer or Rogowski coil. Transducers that require input power have built-in signal-conditioning electronics for a Hall effect sensor or Rogowski coil or both. Yokogawa offers a range of AC/DC current sensors with bandwidths from DC to about 500 kHz depending on the model.
A source of errors that also must be considered when instrument transformers are used is lead impedance. If a meter is built into a control panel, the leads to the meter can be very long and contribute a significant additional amount to the burden impedance. Similarly, the inductance associated with a resistive shunt typically limits frequency response.
Newtons4th has developed a very low inductance current shunt with correspondingly high bandwidth. All conductors have inductance, but the company arranged the signal and return currents to flow in opposite directions on closely spaced parallel conducting planes. In this way, the magnetic flux generated by an element of current flowing in one sheet is cancelled by an oppositely directed element in the other sheet.
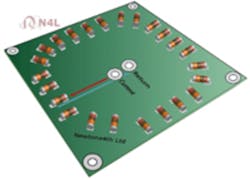
Courtesy of Newtons4th
As shown in Figure 4, a large number of small resistors are radially positioned around the sheet perimeter so that the current is equally shared. The overall result is a 10-mW shunt with only 250-pH inductance. In this example, 24 resistors are used so the shunt can handle a reasonable amount of power even if each resistor is rated at 0.25 W and conservatively derated. As an example, a 10-A current would dissipate 1 W in the shunt. The company’s PPA5500 Power Analyzer is available with three rms current ratings: 10-A low current, 30-A standard, and 50-A high current.
High-frequency operation demands a high sampling rate, and this is a major distinction between analyzers suited to PWM motor drive and electronic lighting ballast work vs. those that handle AC mains and harmonics. Voltech’s PM6000 is one of the fastest analyzers with 10-MHz bandwidth and 40-MHz sampling rate. Most other premium analyzers sample at several megahertz with a corresponding low-megahertz bandwidth.
Xitron claims the single-channel 2801 and two-channel 2802 Advanced Power Analyzers have a good performance-to-cost ratio. Rather than the multimegahertz and multimegasample/s bandwidths and sampling rates of the Yokogawa and Newtons4th analyzers, these instruments sample at 235 kS/s with 16-b resolution. Measurement accuracy is better than 0.1% for normal and low line voltages and for standby currents of a few milliamps supporting use in Energy Star testing applications.
Alternative Energy Applications
Commissioning a new solar installation involves verifying that each string of panels is developing the correct voltage and current levels. Equipment that simultaneously measures several strings saves time and makes it easy to compare results.
The Dranetz PowerXplorer PX5 Power Quality Analyzer can measure the output of up to four strings to a maximum of 1,000 V. In addition, several types of trigger are available based on cycle-by-cycle analysis. Inputs are sampled 256 times per cycle, and rms quantities are computed each half cycle. Triggers include harmonics, flicker, crest factor, and phase unbalance.
The sample rate supports computation of interharmonics as well as up to the 63rd harmonic. Ross Ignall, director of product management at the company, explained, “One application of our products involved a wind farm in the Midwest where the local grid operator was threatening to disconnect the wind farm from the grid because a problem in the wind generators was causing power line harmonics. Our products measured energy production and helped a power quality consultant and the wind-generator manufacturer better understand the problem, preventing disconnection while a solution was found.”
Indeed, the increased use of wind and solar power motivated the latest power-analyzer developments by Outram Research. According to John Outram, managing director at the company, “Where there is generation of energy using renewable sources or sending power back onto the grid, power quality issues will follow, notably in the form of harmonics. Harmonic distortion can become a significant problem as more and more mains-connected devices use high-efficiency switching power supplies or inverter-type power sources and power increasingly is supplied via DC to AC conversion.
“Wind farm systems also can generate interharmonics caused by nonfundamental-related resonances, both mechanical and electrical, as the turbines change from loads to generators depending on the wind strength,” he said.
Outram concluded by saying that although most efforts today were aimed at reducing harmonics below the 50th, to a degree this was because few devices measured disturbances at higher frequencies. The company’s PM7000 Power Analyzer measures up to the 127th harmonic so it can be used to highlight high-frequency effects that he felt inevitably will become problems in the future. Outram Research products are available from Synergy Systems in the United States.
Measurement Requirements
The nature of the application quickly determines the most suitable test equipment. For 50/60-Hz work involving quantities such as real and reactive power, energy usage, and efficiency, a logger or monitor with perhaps 10-kHz sampling is adequate. PWM motor drives, very high-order harmonics, or high-frequency switching as found in electronic ballasts require much higher bandwidth and sampling rates.
The number of signals involved and their amplitudes narrow your choices. Power analyzers are available with a variety of input channels and sensitivities. In some cases, you may need to use external accessories to better match the signal to the instrument. This can be necessary both for large inputs that exceed the basic ratings and for small inputs that must be measured more accurately. A good example of the latter is Voltech’s Universal Breakout Box that has a built-in 1-W current shunt and is tailored expressly to facilitate Energy Star measurements.
Reference
1. “ABB Instrument Transformers: Technical Information and Application Guide,” Rev. A, 2004.
For More Information
About the Author
Comment About the Article
To join the conversation, and become an exclusive member of Electronic Design, create an account today!

Leaders relevant to this article: