Measuring Frequency Response Between I-Q Baseband and RF/IF

Frequency response measurements are a mainstay of RF communications design and generally considered a routine task—unless one of the device ports happens to be at I-Q baseband. Here, the convenience of single-box network analyzers and simple coax connections gives way to more complex, homespun test systems with setup subtleties that can make the difference between valid and invalid test results. Fortunately, innovative new capabilities in vector signal analysis now provide engineers with tools to address these measurement challenges.
Warning: Obstacles Ahead
Traditional network analyzers sweep a continuous wave (CW) signal source across the frequency band of interest while two or more receivers capture and measure the signal as it appears at the input and output ports of the DUT. In the simplest of implementations, these receivers may be just power sensors, in which case the resulting response measurements will be limited to magnitude-only (scalar) data.
However, for characterizing transmit or receive signal paths, scalar results alone are rarely sufficient since complex-modulated signals are affected by both the magnitude and phase responses of the circuits that carry them. This necessitates measurements such as phase response, group delay flatness, and complex impedance match that, in turn, require receivers that are not only phase-capable, but also synchronized with each other to within fractions of a degree of phase.
While RF and IF network analyzers have long provided these capabilities, obstacles arise when either of the DUT’s ports is at I-Q baseband—for example, where I and Q signals appear as separate waveforms at physically discrete test points. This raises an immediate connectivity issue, because few (if any) commercial network analyzers actually support I-Q inputs or outputs. Their sweeping source is centered at some IF or RF frequency rather than DC, and their inputs and outputs are designed to connect to a single test point instead of two.
As a result, engineers must develop test setups from individual instruments, configuring them appropriately to ensure the required synchronicity for valid phase measurements. In these cases, vector signal analysis software like Agilent’s 89600 VSA can provide the necessary glue to make all the components work together as a single test instrument.
Addressing the Challenges Head On
The first problem, physical connectivity, is solved by the software’s capability to support a wide range of instrument front ends. The user simply configures an instrument with the appropriate frequency range and input topology to be controlled by the software. The software then acquires the signal-of-interest and post-processes it to obtain the desired measurement results, ranging from basic spectrum and waveform measurements to complex modulation analysis. In its latest release, the 89600 VSA Software has been enhanced to perform two or more independent measurements simultaneously, using multiple hardware front ends.
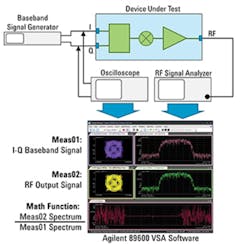
Figure 1. Frequency Response Measurement Based on Simultaneous Capture of I-Q Baseband and RF Output Signals
Figure 1 shows a typical measurement setup. The stimulus signal is sampled first at I-Q baseband by the oscilloscope (taking advantage of its dual-channel inputs) and then again at RF by a traditional signal analyzer. The software collects the waveforms from both instruments, internally combining the separate I and Q signals from the scope into a single I+jQ signal. Each input then becomes the basis for a separate measurement, with the results displayed side-by-side in the 89600 VSA window.
In addition, multiple results can be combined mathematically into custom results via user-defined math equations. In fact, the complex transfer function measurement we seek is exactly this—the result of separate baseband and RF measurements expressed in ratio form.
The final element to the setup is a stimulus source. While signal generators are widely available with I and Q baseband outputs, the signals available at these outputs generally are complex modulation and not sweeping sine waves. Fortunately, there is no requirement that frequency response be measured with sinusoidal signals. It can be measured just as readily with a broadband stimulus, for example, the target modulation for the system being developed. There actually are advantages to performing the measurement this way, such as more realistic power and thermal loading and more representative peak-to-average statistics.
For this example measurement, the stimulus will be a broadband, QPSK-modulated signal that is readily available at the generator’s I-Q outputs. The 89600 VSA software then is configured to perform two measurements simultaneously:
• Measurement #1 (Meas01) is modulation analysis of the QPSK baseband signal using the waveforms acquired by the scope.
• Measurement #2 (Meas02) is a similar QPSK modulation analysis performed at RF using the waveform acquired by the signal analyzer.
Measurement displays are user-selectable. In this case, two display traces are configured: constellation diagrams for a quick visual check of signal integrity and spectrum displays for each signal.
The spectrum displays are critical because they represent the spectral content of the signal during a precisely known time interval (for example, over the block of QPSK symbols being demodulated). So as long as the demodulators for Meas01 and Meas02 are demodulating the exact same set of symbols, the spectra satisfy the synchronization requirement. All that remains is to define another trace showing the simple math function Meas02/Meas01, which now represents the complex transfer function between baseband and RF.
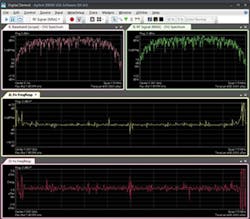
Figure 2. 89600 VSA Software Displaying Magnitude and Group Delay Plots for a Baseband/RF Transfer Function Measurement
Figure 2 shows the resulting measurement displays, including both magnitude response and phase linearity (group delay). The measurement is not entirely noise-free because the energy in the noise-like stimulus signal is not distributed uniformly across the measurement span. Frequency points receiving less energy at the moment the measurement is performed will show higher variance, especially those on the skirts of the stimulus signal. To address this phenomenon, set the demodulator to demodulate longer blocks of symbols (up to 4,096) and allow averaging to have its smoothing effect.
Several techniques are available to ensure that the demodulators are processing the exact same set of symbols. In the simplest case, an external trigger signal is routed to both analyzers in parallel, causing them to acquire their signals simultaneously. Minor timing offsets due to unequal trigger sensitivities and latencies are accommodated by the demodulators because they inherently synchronize to the nearest symbol.
Another time-alignment technique utilizes the sync-search functionality of the demodulators. This function searches through an incoming block of symbols until a predefined pattern is found and then begins demodulating at that point. Since the baseband and RF signals represent the same waveform, any arbitrary block of symbols will appear at both points and can be used for synchronization.
Finally, some signals (OFDM, in particular) are designed with strong equalization in mind. Their waveforms include built-in elements such as preambles, training sequences, and/or pilot carriers that enable a receiver to quickly measure and adapt to transmission channel characteristics.
The VSA software’s demodulator also performs this characterization. But because it typically is hard-wired to the DUT, the channel characteristics are negligible, and the resulting display is simply the signal’s complex frequency response at the point of measurement. Taking advantage of the multimeasurement feature, this frequency response can be measured simultaneously at baseband (Meas01) and RF (Meas02) test points so that the resulting display of Meas02/Meas01 again represents the desired complex frequency response.
Summary
Baseband-to-RF transfer function measurements are decidedly nontrivial to perform. Luckily, with some attention to technical detail, and assisted by new tools such as the 89600 VSA Software’s multimeasurement feature, such measurements now are within practical reach for RF test engineers.
About the Author
Ken Voelker is a senior product planner for Agilent 89600 VSA Software. He is a 32-year veteran with Agilent Technologies. Agilent Technologies, Microwave & Communications Division, [email protected]
About the Author
Comment About the Article
To join the conversation, and become an exclusive member of Electronic Design, create an account today!

Leaders relevant to this article: