The Uncertainty About Jitter

Volumes have been written about jitter, an indication of the complexity associated with timing uncertainty. Actually, timing errors are easy to measure. It is in the assignment of blame that the confusion arises.
Jitter is defined as the deviation of data stream threshold crossings from their ideal timing. However, the capabilities of the instruments used to measure jitter influence the definition. For example, a timing interval analyzer (TIA) measures the time from a start to a stop event. If the events are successive threshold crossings, then the TIA effectively is measuring variations in pulse width.
In contrast, a direct-sampling digital oscilloscope (DSO) may post-process acquired data to extract a reference clock against which the interpolated threshold crossings of all the data bits are compared. Equivalent-time-sampling instruments have yet different qualifications on their jitter measurement capabilities.
Jitter measured with a bit error ratio tester (BERT) is the standard against which other methods are judged. Rather than try to quantify the jitter of a system’s own signals, a BERT provides a bit stream and compares the system’s output to the known input. If a BERT is allowed to run for a sufficiently long time, it will give a definitive measure of the bit error ratio (BER).
LeCroy’s David Li, product marketing manager for serial data solutions, explained, “The purpose of BER testing during receiver characterization is to evaluate the tolerance levels of a receiver to a variety of noise components. These noise components from an actual device under test can be simulated by the current technology in today’s BER tester. LeCroy’s PeRT3 products do exactly this.” He continued, “By generating specified and controllable amounts of noise on a signal, we can test the tolerance level of a given receiver to different types of noise…. Applications…required to be tested today include dynamic equalization testing in PCIe Gen3 and asynchronous testing in Super Speed USB.”
After arriving at a value for the total jitter (Tj), the challenge is to determine the constituent parts of the overall jitter distribution. Because generally there is some portion of the jitter caused by a random process, the longer that data is acquired, the higher the measured jitter becomes. Requiring that Tj is bounded restricts how the measurement is made. One source defines Tj as an “expected value of peak-to-peak observed time interval error (TIE) jitter for a specified number of observations.”1
Jitter Decomposition
Tj subsequently is apportioned between deterministic jitter (Dj) and random jitter (Rj), and this is where jitter becomes interesting. A number of plausible approaches have been suggested. One method is based solely on the spectrum of the jitter—the FFT of TIE(t). The reasoning is that random processes contribute to the noise floor, and deterministic processes result in spectral lines and peaks. However, jitter caused by incoherent or nonstationary periodic aggressors doesn’t fit this model.
Courtesy of Tektronix
Crosstalk from an adjacent data signal and spread-spectrum clocking are, respectively, examples of these. “In effect, any wideband aggressor which contributes bounded timing fluctuations will be indistinguishable from the noise floor, and consequently counted as Rj.”1
It also is possible that a large number of small deterministic jitter sources are affecting a signal. According to the central limit theorem, the overall effect of a number of bounded sources would have a Gaussian distribution that could be construed as contributing to Rj.
Accurately determining Dj and Rj is the first step in further Dj decomposition. Dj comprises both correlated and uncorrelated jitter. Correlation here relates to a repetitive data sequence such as would be required for jitter determination by a sampling scope. The source of the jitter could be periodic, termed periodic jitter (Pj), but if not correlated to the repetitive sequence being measured would be considered uncorrelated Dj. To distinguish uncorrelated Dj from Rj—which also is uncorrelated—this type of Dj is called bounded uncorrelated jitter (BUj) where true Rj is unbounded.
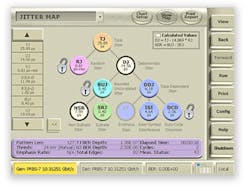
Correlated Dj results from inter-symbol interference (ISI) and duty-cycle distortion (DCD)—both forms of data-dependent jitter (DDj)—as well as subrate jitter (SRj). SRj is caused by a periodic clock-related effect. For example, if one path through a four-way multiplexer were faster than the other three, SRj would occur at a quarter of the clock rate. Figure 1 shows the jitter hierarchy in graphical form. NSR is BUj that is not caused by subrate effects.
ISI relates to the effect of a previous bit state on the analog levels of subsequent state(s). If a string of data 1s is followed by a 0, the transition will start at a higher voltage than if the 0 follows only a single 1. To the degree that it does, the position of the falling edge will slightly shift in time. This effect is most severe for high-speed data in a band-limited channel: for example, fast data transmitted a relatively long distance across an FR4 PCB.
Pre-emphasis mitigates ISI by increasing the amplitude of initial 1-0 or 0-1 transitions in relation to the bits immediately following with the same state. Alternatively, the process can be described as de-emphasis, in which the immediately following same-state bits are reduced in amplitude compared to the initial transition. Either way, the channel-dependent variation in bit timing is reduced.
Anritsu’s Hiroshi Goto, business development manager, said the company “has developed a method for finding the ideal emphasis signal that matches the transmission path characteristics. By combining Anritsu’s VectorStar® MS4640A VNA, MP1800A [BERT], MP1825B [4-Tap Emphasis Filter], and MX210002A [Transmission Analysis Software], it is possible to make S-parameter measurements and use a simulation package, such as AWR’s Microwave Office, to predict the nonequalized eye pattern. Further,” he concluded, “it is then possible to use the measured S-parameter data to program the equalizer with optimum tap settings to obtain an open eye at the receive end.”
Equalization
Agilent Technologies’ Serial Data Equalization software analyzes eye diagrams both before and after equalization has been applied. Brig Asay, product manager for high-performance oscilloscopes, explained, “The …software evaluates decision feedback equalization (DFE), feed forward or linear feed forward equalization (FFE/LFE), and continuous time linear equalization (CTLE). [It] will also find the best-fit tap values for FFE and DFE techniques…. Many times, in addition to providing eye diagrams, users will look at the jitter after equalization is applied.”
Tektronix (Tek) offers the SDLA Toolset that, according to the company’s Chris Loberg, senior technical marketing manager, “applies equalization and de-embed/embed effects to the measured signal to assist in the evaluation of closed eyes. It gives engineers the ability to add or remove channel effects associated with fixtures or test point access and enables the addition of DFE/FFE/CTLE equalization effects to the device under test.”
DPOJET is a Tek jitter and eye diagram tool that provides oscilloscope-based jitter decomposition. It does complete jitter separation into random and deterministic properties including BUj, which is required by many high-speed communications standards. Loberg said, “DPOJET and its extensive measurement library are utilized to make measurements at any point within the link to look at the effects of channel modeling and/or equalization that have been deployed using SDLA.”
LeCroy’s Dr. Alan Blankman, technical product marketing manager for signal integrity, described the company’s recent enhancements to serial data analysis. “The SDAIII-LinQ next-generation serial data analysis package extends our analysis capability to allow users to simultaneously analyze up to four lanes of serial data, where each lane can either contain data from a unique input or can simply be different analysis schemes for the same data. The eye diagrams are displayed in separate frames called lanescapes,” he said. “Additionally, we have created a reference lanescape where users can store data and any analysis views and then compare the reference to subsequent acquisitions.”
Jitter Estimation
Because error ratios need to be very low in communications systems, actually measuring the jitter with a BERT can take a long time and isn’t practical for production testing. A number of alternative methods have been developed that estimate the BER by extrapolating from a smaller number of actual measured values.
Dual Dirac
The dual-Dirac jitter model consists of one bounded Dj process and one unbounded Rj source. The Rj Gaussian splits into left and right parts, separated by the size of Dj. Because the Dj*Rj combination is a convolution, the upper and lower means are not separated by the Dj pk-pk value but rather by some smaller amount. The distinction between bounded and unbounded jitter processes is key because it means that very infrequently occurring events only can be caused by the tails of the Gaussian Rj distribution.
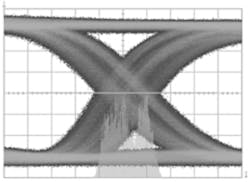
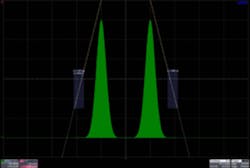
Figure 2. Histogram of the Eye Crossing Point
Courtesy of Agilent Technologies
Starting with an eye diagram that overlays all the data transitions, a histogram is developed that represents the distribution of measured values vs. time offset from the ideal threshold crossing (Figure 2). If the histogram is rescaled to have a maximum value of 1.0, it then becomes a probability density function (PDF). Its peaks correspond to the timing offsets at which the greatest number of threshold crossings occurred. For the dual-Dirac model, the PDF has two sections. A bathtub curve is the corresponding cumulative distribution function (CDF) evaluated in two parts: one for the lower half of the PDF, integrated from left to right, and one for the upper half, integrated from right to left.2
National Instruments (NI) has introduced the NI LabVIEW Jitter Analysis Toolkit that uses the dual-Dirac model. Jordan Dolman, product marketing manager for digitizers at the company, said, “Although these results are not comprehensive over the entire period of measurement, they are statistically relevant in the middle of the eye diagram where digital signals are evaluated. The efficiency of this method is realized by making estimates using the deterministic and random jitter components of the signal under analysis.”
Dolman explained that the toolkit includes color-graded persistence eye diagrams, mask limit testing, and bathtub plots. Other types of plots such as histograms, trend, and spectrum already are provided by LabVIEW. The toolkit also has a signal generator function that facilitates creation of a test signal with user-defined jitter characteristics.
Pattern-Based Methods
In the Agilent 86100C/D DCA-J Sampling Oscilloscope, several hardware enhancements support what a white paper claimed to be “the only jitter analysis system that provides consistent, accurate measurements of TJ (10-12) and its subcomponents…. The DCA-J’s first step is to separate jitter that is correlated to the test pattern by using its built-in pattern trigger and trigger divider to analyze each edge of the pattern independently. The hardware-based DDJ separation technique immediately prevents DDJ from being confused for RJ.”3
A similar approach is used in the Tektronix BERTScope. According to an application note, “[The Jitter Map analyzes jitter] by using a pattern trigger, as has been key to jitter decomposition measurements by common sampling scopes. In addition, the BERTScope’s error location analysis quickly enables the determination of which data bits contribute to bit errors.”4
The BERTScope Jitter Map first determines the jitter of a single data bit edge, which eliminates any DDj effects—the data is not changing. The dual-Dirac method then is used to separate Rj from Dj. This approach is applied to each edge and an average Rj computed from all the separate measurements. Confidence in the accuracy of the measurements is improved by actually measuring a large number of points before extrapolating.
Tek’s Loberg further explained, “The BERTScope collects an error event table, allowing bit-precise error analysis on long-duration BER tests. For example, this allows display of a histogram of the number of errors at each bit in the test pattern to quickly identify troublesome bit sequences.”
Direct-Sampling Approaches
Both the BERTScope’s Jitter Map and DCA-J’s DDj separation techniques are based on a pattern trigger. Determining the jitter components associated with a single, long record on a direct-sampling scope is a different situation. Agilent’s Asay described three approaches that will be available to users of the company’s EZJIT+ Jitter Analysis Software. The first two already are part of the software application with the third method planned for release this month.
“White or wide mode is great for a quick estimate of jitter,” he said. “Because the threshold is fixed, it doesn’t require as much memory as the other jitter separation algorithms. The disadvantage is that with a fixed decision point level, if a user has disproportionate low-frequency Rj, the tool will under-report the Rj.
“Narrow or pink mode is a very nice dual,” he continued, “since it uses the spectral and dual-Dirac methods to separate jitter. Because its decision line is not fixed, it will properly evaluate low-frequency Rj. In most cases, the pink mode is the most accurate method. The one case where it is problematic is when you have crosstalk present. In this case, the algorithm thinks that the BUj is Rj when in fact it is Pj. Thus, pink mode will over-report the total jitter.
“The new method is designed to handle the case of crosstalk. It uses a tail-fit method that does not make the basic assumption that a dual-Dirac method does that Pj is both Gaussian and bimodal. As a result, it is able to properly bucket crosstalk as Pj. Clearly, the advantage is that it properly buckets crosstalk as BUj. The disadvantage is that it is new to the EZJIT+ and will take time for users to adapt to it,” he concluded.
Q-Scale Jitter Decomposition
Rather than working directly with the jitter or its distribution, the Q-Scale method is based on the integral of the jitter histogram—the so-called empirical distribution function. A normalized version of Q-Scale finds the best-fit straight lines with slope 1/σ, corresponding to standard deviations of the right- and left-side dual-Dirac Gaussians (Figure 3). As described in Reference 1, this process “yields the most linear behavior for each extreme, and …thereby obtain[s] estimates for the mean, sigma, and weight of the dominant contributors.”
Courtesy of LeCroy
Equally important, as the reference noted, “[the normalized Q-Scale method] confirms or not if Gaussian behavior is observed in the measurement. When this occurs, you have a warning that the predicted results are suspect.”
Amplitude Noise Statistics
In an effort to extend the information available from signal integrity analysis, several companies offer tools that estmate eye variations in two directions: conventionally with respect to time as well as vertically. Amplitude noise can be separated into its constituent parts in the same way as timing jitter. The capability to do so can help to identify the root cause(s) leading to a high BER.
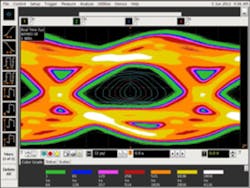
According to Agilent’s Asay, “EZJIT Complete is an extension of the EZJIT+ software application, which allows the user to break down the noise of a real-time eye into random and deterministic components. This is important for understanding eye-closure situations beyond simply jitter.” Figure 4 shows a plot generated by the company’s Eye Contour Tool used for finding BER of both eye axes.
Courtesy of Agilent Technologies
LeCroy’s Blankman said that along with the SDAIII-LinQ package, the company also was releasing the SDAIII-CrossLinQ and SDAIII-Crosstalk applications that extend analysis to include noise and crosstalk. The Crosstalk Eye results from an analysis of the residual noise on a signal due to crosstalk and reveals noise on a data pattern in a new way. Also, there is a Crosstalk Eye Comparison mode shown in Figure 5 that overlays two crosstalk eyes, allowing quick comparison of either different channels or when the aggressor is on or off.
Tek’s 80SJNB application is a timing and noise analysis toolset used with the company’s DSA8300 Series Sampling Oscilloscopes. According to Tek’s Loberg, “The toolset performs timing and noise-based analysis to get a 3-D view of the eye’s performance for deeper, more accurate evaluation. The DSA8300 Series supports up to 50-GHz electrical and optical signal access for the latest high-speed communications signal acquisitions.”
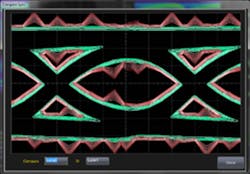
Courtesy of LeCroy
Summary
There is no shortage of jitter and noise analysis tools. The challenge is not whether you can accomplish a certain measurement or subsequent analysis but rather to be clear about what you actually need to do. Direct-sampling scopes impose the least restrictions on the signal. However, they do not offer the same level of jitter decomposition performance as a sampling scope. Neither is their estimate of total jitter equivalent to that provided by a BERT. In addition, a BERT identifies the data transitions associated with observed errors.
Nevertheless, a BERT is not unique in this respect. The 3.50 version of Agilent’s SDA software now supports user prequalification of eye data. You can select the nature of the data transitions, such as eight consecutive 0s followed by a 1, from which the eye will be constructed. SDA software can be used with the company’s 90000 Q-Series Oscilloscopes to recover clocks at greater than 100 Gb/s.
References
1. Miller, M., and Schnecker, M., “A Comparison of Methods for Estimating Total Jitter Concerning Precision, Accuracy, and Robustness,” DesignCon 2007.
2. Relationship Between Eye Diagram and Bathtub Curves, WAVECREST, Technical Bulletin #13, 2003.
3. Stephens, R., Jitter Analysis: The Dual-Dirac Model, RJ/DJ, and Q-Scale, Agilent Technologies, White Paper, 2004.
4. BERTScope Bit Error Rate Testers Jitter Map “Under the Hood;” A New Methodology for Jitter Separation, Tektronix, Application Note, 2010.
For More Information
Agilent Technologies
Anritsu
LeCroy
National Instruments
Tektronix
About the Author
Comment About the Article
To join the conversation, and become an exclusive member of Electronic Design, create an account today!

Leaders relevant to this article: