Reliability Screening for Electromechanical Relays
The cost of component failures continues to increase as electronic products become more complex. Most component replacement costs are associated with marginal devices that become intermittent or fail after the end product has been shipped to the customer. The cost of replacing a defective component prior to shipping the end product is small by comparison.
To illustrate a method for improving the long-term reliability for a population of electromechanical (EM) relays, two relay types were used in the investigation: a miniature armature relay in a single pole double throw (1 Form C) configuration and a single pole single throw (1 Form A) reed relay packaged in a four-pin SIP. Both relay types are targeted for low-level signal switching (25 to 50 watts).
Parametric Screening
The standard parameters for EM relays were evaluated.1 These parameters include the pick-up and release voltages, operate and release times, contact resistance, contact resistance stability, and contact magnetostrictive resistance.2 The contact resistance stability (RDEL) is a standard testing method to assure that multiple readings are consistent with small variations. This provides a look at the quality of the contact surfaces (smooth and without contamination) and the quality of the mechanical structure (contacts are well aligned). One of the primary causes of early life failures is excessive contact resistance due to insulating films, oxides, or organic films and insulating particles.
Another very effective test for screening contact quality is called the magnetostrictive twist test.3 This test searches the contact area for contaminated spots, which give rise to a high contact resistance. This test is affected by tilting the contact surfaces relative to each other while measuring the contact resistance. A magnetostrictive phenomenon appears when a magnetic field is present simultaneously along the axis and the circumference of a ferromagnetic bar. The resulting magnetic field is at an angle to the bar’s axis, and the corresponding magnetostrictive changes in length and diameter result in a twist of the bar at some angle.
This test is applicable to dry reed relays. In a reed contact, the axial and circumferential fields can be generated, respectively, by energizing the coil and measuring current through the reed contact. It has been demonstrated that high contact resistance readings under twist conditions are indicative of poor contact quality.
Parametric data was collected on samples of both relay types. The mean value and variation (sigma) were calculated for each electrical parameter. All the electrical parameters were within the manufacturer’s specifications. The screening criterion established was mean value plus 3 sigma. While this limit generally was within the manufacturer’s limits, outliers are indicative of process variations that result in early life failures. Of all the parametric tests, the two that provide the best indication of early life failures for relays are RDEL and contact resistance twist.
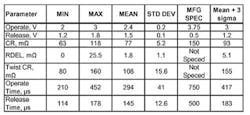
The parametric data summaries are shown in Table 1 and Table 2. Both part types have nominal 5-V coils that are specified at 3.75 VDC for pick-up. The contact surface for the reed relay is smaller than the armature relay, and this is seen in the lower contact resistance mean value for the armature relay. The contact twist resistance test is only suited for the reed type of relay due to the cantilevered structure of the contact arms. Table 1 shows that the mean contact resistance for the reed relay increased from 77 mW to 108 mW under twist conditions. The screening limit for this test was set at 155 mW. The limits set for RDEL varied between 4 mW to 5 mW for this study.
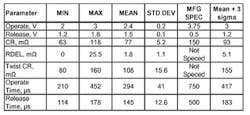
Table 1. Parametric Data for SIP Reed Relay
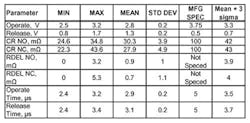
Table 2. Parametric Data for the Armature Relay
Life Testing
Life tests were run with samples from both relay types. The results were plotted using a two-parameter Weibull cumulative distribution (CDF).4 The Weibull CDF is defined by the following equation:
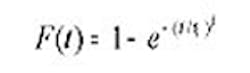
where: F(t) = fraction failing CDF
t = total number of test cycles
η = number of cycles where 63.2% of the population has failed (characteristic life)
β = slope parameter
When failures are plotted on a Weibull chart, the plot will form a straight line if the failures fit the Weibull distribution function. If the fit parameter ρ = 1, the data points are on a perfect straight line. For this study, all the plots showed ρ greater than 0.95. The slope of the line is determined by beta (β). Beta provides an indication if the failures are random, early life, or end of life,
where: β < 1 the failure rate is decreasing (infancy)
β = 1 the failure rate is steady state (random failures)
β > 1 the failure rate is increasing (wearout failures)
The actual failures as well as the total number of samples in the test affect the plot line. Confidence bounds can be calculated for the distribution, and running a high percentage of the samples to failure can tighten these bounds. An advantage of running relay life tests is that time can easily be accelerated (run the relays at faster cycle rates than the actual application). Since time can be accelerated this way, a high percentage of the sample can be run to failure. Therefore, small sample sizes (typically less then 30 pieces) can be used with good results. The number of cycles expected for a particular failure rate also can be derived from the Weibull plot. For example, from Figure 1, the B1 failure rate (number of cycles for a 1% failure rate) is about 20 million cycles.
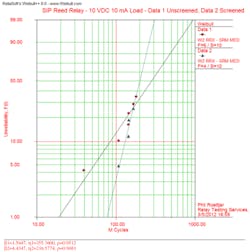
Figure 1. SIP Reed Relay Comparison of Screened and Unscreened Population
Reed Relay Life Test Results
For the reed relay, life tests were completed with an unscreened population (as received directly from the manufacturer), for a screened population (remove mean plus 3 sigma outliers), and for a population of screen rejects (only parts that are rejected by the screen). These life tests ran with the relays hot-switching a 10-VDC 10-mA resistive load at cycle rate of 200 Hz (5 ms). Parts were counted as miss failures if after 1 ms the contact resistance was greater than 1 W. A stick failure was counted if the load voltage had not increased beyond 0.6 V after 1 ms.
The Weibull plot for the screened and unscreened SIP reed relays is shown in Figure 1. For this test, 16 parts were tested with six failures, all for misses. It can be seen from the Weibull plot for the unscreened population that β = 1.56, η = 355 million cycles, and the B1 life is approximately 20 million cycles. Two parts from this sample would fail a mean plus 3-sigma screen. The first part failed for CR max at 95 mW and RDEL at 25.5 mW. The second part failed for CR twist with a reading of 188 mW. These parts were removed from the sample, and the remaining parts were plotted.
The second plot line in Figure 1 shows the screened population. Beta increased to 4.43. A higher beta generally is better since it implies the parts are in the wear-out portion of their life with no infancy issues. The B1 life increased from 20 million to approximately 75 million cycles (275%).
A life comparison of the screened SIP relay population vs. one populated with all screen rejects is shown in Figure 2. The difference here is dramatic, with the screen reject sample demonstrating a β = 0.577 and a B1 life of about 35k cycles. While this is not a totally fair comparison since this population is purposely skewed with process outliers, it does illustrate that something is clearly different with these parts. They certainly show a high level of infancy as indicated by the very low beta. These parts are process anomalies that lie outside a tight control limit around the process mean. The contacts on these parts are most likely compromised with possibly rough uneven surfaces, poor contact alignment, or some type of contamination on the contact surfaces.
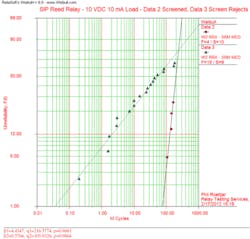
Figure 2. SIP Reed Relay Life Test Comparison with Screen Rejected Parts
The parametric data for the 28-piece sample is shown in Table 3. All of these parts meet the manufacturer’s specifications; however, they all have high RDEL, high twist resistance, or both. Six samples (#22, 23, 24, 25, 27, 28) also have contact resistance that is higher than the mean plus 3-sigma limit of 93 mW. While not all of these 28 samples failed early, 60% (17) did fail prior to the first failure in the screened population at 100 million cycles. The good news is that all of these parts can easily be weeded out with a mean plus 3 sigma screen on the contact parametric data.
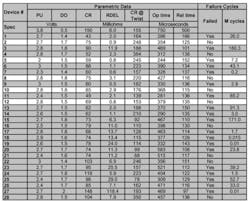
Table 3. Parametric Data for Screen Rejects – SIP Reed Relay
Armature Relay Life Test Results
The armature relay sample was run in life tests hot-switching a 3-VDC 60-mA resistive load. The relays were switched at 20 Hz (50 ms). The miss and stick limits were 1 W and 0.6 V, respectively. Failures were counted when the parts remained above these levels after 10 ms.
Fourteen parts were run in this life test. The unscreened population had a total of four failures, all for misses. Miss failures occurred at 288k, 1,296k, 1,872k, and 1,900k cycles. The early life failure at 288k cycles could be eliminated with a mean plus 3 sigma screen. This part had high CR and RDEL values of 44 mW and 5 mW, respectively, on the failing (normally closed) contact. The plots for the screened and unscreened populations are shown in Figure 3. The β increased from 0.8 to 2.2, and the B1 life increased from 50k to 600k cycles (1,100%) for the screened population.
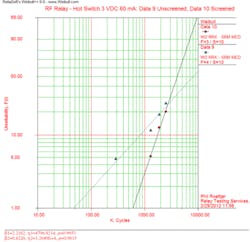
Figure 3. RF Relay Weibull Comparison
Conclusion
It has been demonstrated through life tests that the reliability of a given population of electromechanical relays can be improved by simple up-front parametric screening. The screening criteria are very simple: collect data on the standard parametric tests, find the mean value and distribution for each test, and then set the limit at the mean plus 3 sigma. The most reliable parts from any manufacturing process are the ones that are closest to the mean value of the parametric distributions. The further a part moves away from this mean value, the higher the risk that this part will demonstrate an early life failure.
This concept is true for most manufactured parts, not just electromechanical relays. Ideally, you would like the manufacturer to set specifications as tight as possible around the process mean. However, suppliers also are driven by the bottom line of selling their parts, and they would like to be able to sell everything that comes off their process line. That is when a simple incoming inspection screen can make dramatic changes in the reliability results for specific part. A mean plus 3-sigma screen should result in a loss of no more than 1% of the overall population.
The test results for the two part types studied here show improvements to the B1 life of 275% to 1,100%. This is the kind of difference that saves money in the overall life of a product.
References
1. Sutherland, E.F., “Quality and Reliability Considerations for Users of Dry Reed Relays,” MICRO ELECTRO, May 1987.
2. Roettjer, P.G., “Improving the Reliability of Dry-Reed Relays,” EE-Evaluation Engineering, December 2005, pp. 42-45.
3. Sutherland, E.F. “Measuring the Quality of Relay Contacts with the RTS-201,” MICRO ELECTRO, October 1987.
4. Roettjer, P.G., “Life Testing and Reliability Predictions For Electromechanical Relays,” EE-Evaluation Engineering, June 2004, pp. 58-61.
About the Author
Phil Roettjer is president of Relay Testing Services. Before joining RTS 10 years ago, he worked for more than 20 years on the development of hard disk drives, his last positions as the director of quality for the High-End Disk-Drive Division of Maxtor and as vice president of customer engineering with Quantum. [email protected]
For More Information
About the Author
Comment About the Article
To join the conversation, and become an exclusive member of Electronic Design, create an account today!

Leaders relevant to this article: