Real-time jitter measurements

Jitter measurements are among the most important ways of evaluating the performance of serial digital data links as well as clocks. The oscilloscope is by far the instrument most commonly used for this measurement due to its flexibility and capability to measure clock and data signals.
In recent years, the dominant method for measuring jitter has been processing a long, real-time acquisition of a signal and analyzing the timing of its transitions. While this method has provided high sensitivity and accurate results in most cases, the problem always has been the limited time window over which the measurements are made. Even with hundreds of millions of signal samples available for processing, the absolute time interval over which measurements are made is relatively short. For example, a 100-Msample acquisition at 20 GS/second amounts to only 5 ms while a long pseudo-random data sequence at 5 Gb/s such as PRBS31 repeats in 400 ms. Jitter is not a stationary process, and it can vary widely depending on the time at which it is observed.
While compliance to a given standard such as PCI Express or SATA can be effectively measured using batch processing of a long signal acquisition, a better method is needed to see jitter over longer time intervals and long PRBS patterns. The application of ASIC technology to the acquisition section of an oscilloscope can be used to provide essentially continuous time coverage of jitter measurements, enhancing the capability to measure intermittent jitter as well as long data patterns.
One instrument that uses an ASIC is the RTO oscilloscope from Rohde & Schwarz. The ASIC, called the RTC, sits in the acquisition path between the ADC and the acquisition memory (Figure 1). The RTC performs a number of tasks including triggering, memory management, waveform histogram computation, and mask testing. Each ASIC is capable of processing the data from two ADCs operating at a sampling rate of 10 GS/s so it can process data at a rate of 20 GS/s.
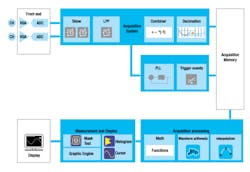
The blocks shaded in blue are implemented in the RTC ASIC.
A significant benefit of the RTC is that triggering is performed on the digitized signal as it exits the ADC, and it is ideal in that it adds no noise or jitter to the displayed waveform. The trigger block within the ASIC includes a clock recovery block that also uses the digitized signal waveform and, as a result, is ideal in the same way as the trigger is.
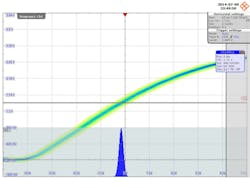
Figure 2 is a screen image of the rising edge of a 5-MHz clock measured on the RTO with the trigger type set to clock recovery (CDR). The apparent width of the edge is caused by the clock jitter relative to the recovered clock, and the histogram overlaid on the image is the edge timing at the point where the signal is at half amplitude. Using the ASIC, the oscilloscope measures the clock edge 1 million times each second.
Time coverage
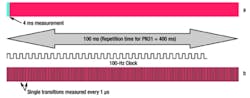
Batch-mode jitter measurements use a relatively small time interval limited by the available memory in the oscilloscope. Once acquired, the time record is processed to provide jitter and eye pattern measurements. An approximate time line is shown in Figure 3a. The acquisition time is simply the number of samples acquired divided by the sampling rate of the ADC.
The time line shown in Figure 3a assumes that the signal bit rate is 5 Gb/s, the ADC sampling rate is 20 GS/s, and the memory is 100 MS for the batch-mode measurement. The batch-mode measurement time interval is 5 ms, representing a total of 12.5M signal transitions assuming a density of one-half; that is, on average, half of the bits transition in any given bit interval. The number of jitter measurements is quite large, but it is only observed over a small interval.
The time line in Figure 3b shows the measurement intervals for a real-time jitter measurement at a rate of one measurement every 1 µs. Over a 100-ms interval, 100k edges are measured using this method. Note, however, that the measurements are evenly distributed over the interval whereas the batch mode is processing the single 5-ms time interval over the same time. For scale, two items were added to the image: a 100-ms time line equivalent to one-quarter of the time required for a PRBS31 to repeat and a 100-Hz clock.
The recovered clock used as a jitter reference is derived from the digitized waveform in the batch-mode measurement. This reference clock is computed over the relatively small time interval over which the signal is acquired and must be recomputed on each subsequent acquisition.
On the other hand, the real-time digital clock recovery performed in the ASIC uses the digitized waveform in the same way as the batch mode but, unlike the batch mode, the recovered clock tracks the signal phase continuously. It is this continuous clock recovery that allows jitter measurements to be made at widely spaced intervals. Since digital receivers also track the signal phase continuously, the real-time measurement more closely matches the real-world operation of the digital transmission.
Intermittent jitter
As mentioned, jitter is not stationary and can occur over fairly long intervals. For example, when a number of digital signals line up in such a way that they transition from one level to another at the same time (simultaneous switching), power integrity issues can result, leading to jitter or even external interference that occurs over long time intervals. In these cases, jitter can be missed using batch-mode methods. This is similar to “rare event capture” in which the oscilloscope update rate increases the capability to find rare events in the time domain.
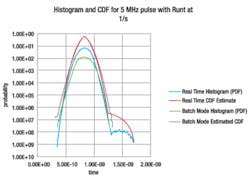
Figure 4 shows the histogram of a jitter measurement on a 5-MHz clock signal with an intermittent runt pulse. Because it has lower amplitude than the other pulses, the time at which the runt pulse crosses the voltage threshold (2 V in this case) is offset from the mean transition time of all of the other edges. The runt pulse repeats once every second so it cannot be captured in a single batch acquisition. However, the real-time method, even at a measurement interval of 1 µs, covers enough time to capture the event.
Since the measurement update rate of 1 µs is asynchronous with the runt pulse, the transitions of the clock that are measured represent a random sampling of all transitions. The runt pulse will occur at least once to a 90% probability over a 40-s observation time.
The histograms of the timing jitter measured using both the batch mode and the continuous mode methods are shown in Figure 4. The two other curves on the chart are the cumulative density functions (CDF) curves and indicate the probability of the clock edge transition happening at a given time from nominal. The peak value of each CDF is one-half, indicating that the clock will transition early or late with equal probability.
The CDF measured using the continuous mode clearly shows a bump in the tail at about 660 ps from the peak. The cumulative probability at this point is a bit more than 1×10⁻⁷. Recall that the runt pulse was injected at a rate of once per second and, since there are 5 million clock pulses each second, the probability of the runt occurring is 1/5 x 106 or 2 x 10⁻⁷. On the other hand, the batch-mode measurement has no indication of the runt happening. This is because the acquisition window for the batch-mode measurement is roughly 4 ms out of every 2 seconds. While a number of 4-ms batches were measured, the large time gap between them means that the probability of measuring the runt is nearly zero.
Conclusion
Traditional batch-mode methods for measuring jitter using real-time oscilloscopes, while providing very accurate and repeatable measurement results, are limited in their time coverage. One solution to this problem is the application of high-speed ASIC technology to provide real-time clock recovery and jitter measurements. The wide time coverage of this method allows the capture and measurement of even low probability events such as the repeating of long pseudo-random bit patterns as well as external interference.
About the authors
Mike Schnecker, the business development manager at Rohde & Schwarz, received a B.S. from Lehigh University and an M.S. from Georgia Tech, both in electrical engineering. He has 22 years of experience in the test and measurement industry in applications, sales, and product development roles. Prior to joining Rohde & Schwarz, Schnecker held positions at LeCroy and Tektronix. [email protected]
Dave Rishavy is the Rohde & Schwarz America’s director of the oscilloscope product family. Prior to joining the company, he worked for 15 years in the test and measurement field at Agilent Technologies in areas such as application engineering, product marketing, marketing management, and strategic product planning. Rishavy has a B.S. in electrical engineering from Florida State University and an M.B.A. from the University of Colorado. [email protected]
About the Author
Comment About the Article
To join the conversation, and become an exclusive member of Electronic Design, create an account today!

Leaders relevant to this article: