It’s not always obvious that AC power measurements involve high frequencies, although the number of applications that do continues to increase as more semiconductors are applied to power control. Variable frequency drives (VFD) for electric motors present this kind of challenge.
VFDs have become popular because they enable very efficient motor speed control while also providing the torque that the load requires. Estimates vary, but about 45% of the power generated in the world runs electric motors, so improving efficiency by even a small amount can have huge benefits overall.
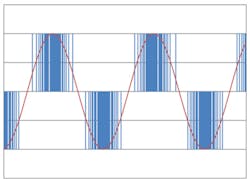
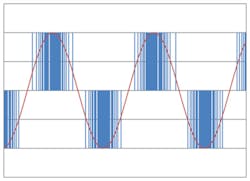
To achieve high efficiency, semiconductor switches should be on or off. This is the reason that so many electronic control systems use pulse width modulation (PWM) to drive loads like motors. The VFD’s output pulses are integrated by the motor’s inductance, approximating a variable frequency sine wave. Figure 1 is an Excel-generated graphic that gives the general idea. The figure represents a bipolar PWM system. There also are unipolar PWM drives in which the output is offset from ground by the peak AC voltage.
In either case, the frequencies associated with PWM output pulses are much higher than the fundamental motor frequency. According to an ABB application note,1 some VFDs produce rise times as fast as 0.1 µs. These drives have a correspondingly high rate of voltage change (dV/dt), which stresses a motor’s insulation and can eventually cause it to fail.
When a fast pulse edge is applied to a motor, a large voltage overshoot is developed across the series inductance of the power lead and the motor. In addition, because of the impedance mismatches between the VFD output and the motor/power lead circuit, oscillation will follow the overshoot. As reference 1 stated, “In commercial buildings, a high switching frequency can generate excessive levels of RFI and EMI. Such interference is reduced by using a lower PWM switching frequency. When a VFD is designed to operate at a lower switching frequency, it can produce PWM pulses with a longer rise time and so a lower dV/dt. This results in a lower peak voltage at the motor.”
To investigate the efficiency of a motor being controlled by a VFD, you need a power analyzer that simultaneously measures the input power, typically 3-Φ in an industrial application, as well as the motor’s mechanical output power—torque multiplied by RPM.
Power
AC voltage and current are reported as RMS quantities. The general formula for discrete samples is familiarbut doesn’t tell the whole story. Accurate AC measurements require sampling that is synchronous with the fundamental frequency. Or, if the sampling isn’t directly related to the fundamental frequency, at least the fundamental must be known so that samples can be associated with each cycle.
Apparent power = VRMS x IRMS. True power is proportional to the sum of the products of simultaneous current and voltage samples during one cycle. True and apparent power are different in most power applications because voltage and current generally are not completely in phase—one lags or leads the other. This gives rise to the relationship
true power = VRMS x IRMS x cosØ
where:
cosØ = the power factor
Ø = the phase angle between voltage and current
The vector difference between true and apparent power is called reactive power—measured in VARs—and equal to VRMS x IRMS x sinØ.
Applications such as measuring VFD-motor efficiency present a problem. On the one hand, high frequencies are involved that may affect power calculations if the voltage and current at those frequencies are in phase. On the other hand, the fundamental must be accurately known to compute RMS values. Power analyzers address these conflicting requirements in several ways.
Many measurements can be derived from the basic data. As an example of what’s possible, Keysight Technologies’ IntegraVision PA2200 Series analyzers can display voltage and current; true, apparent, and reactive power; harmonics; crest factor; power factor; duty cycle; and period and frequency. In addition, the PA2200 can apply a wide range of mathematical operations on waveforms such as addition, subtraction, multiplication, derivative, integral, FFT, and square root.
Some analyzers filter the AC input to eliminate high frequencies and base their measurements on what’s left. This approach avoids aliasing and makes it easy to determine the fundamental frequency and the corresponding RMS values. Of course, any high-frequency power contributions are lost.
In contrast, ZES Zimmer has adopted a two-path design for the Model LMG670 precision power analyzer in which the input simultaneously is digitized both by a high-speed ADC as well as by a low-speed ADC. The two paths allow both low-frequency motor and high-frequency electronic drive signals to be processed independently but simultaneously. Anti-alias filtering can be applied or not applied separately in each path. The LMG670 and Fluke’s Norma 4000/5000 analyzers, among others, have very large analog bandwidths compared to their sampling speeds.
Aliasing
If you intend to determine a signal’s frequency content via FFT or DFT means, the sampling process must obey Nyquist’s criterion—the highest signal frequency is less than one half of the sampling rate (fs/2). If frequencies higher than fs/2 are present, they will alias back into lower Nyquist bands, distorting any further analysis.
In an analyzer that simply digitizes the input and computes all measurement values from that data, Nyquist applies. So, in this type of analyzer, either the sampling frequency must be very high or the anti-alias filter may eliminate some of the high-frequency signal content. Chroma ATE’s Model 66202 power meter includes both a low-current shunt with ranges up to 2 A and a high-current shunt with up to a 20-A range. This 16-bit instrument has a 10-kHz bandwidth and a 240-kHz sample rate.
As stated in the Hioki PW6001 datasheet, the analyzer uses an 18-bit ADC sampled at a 5-MHz rate to provide a 2-MHz bandwidth and ensure there can be no alias errors. The instrument features digital processing that independently determines period, wideband power analysis, harmonic analysis, and waveform analysis without interaction and with a 10-ms data update speed.
If you are only interested in scalar time-domain quantities such as power, Nyquist doesn’t apply. Fluke and other similar analyzers don’t have to apply anti-alias filtering when computing power. They do need to accurately determine the fundamental frequency so that the voltage and current RMS values can be calculated. This can be accomplished, as described in a Newtons4th (N4L) application note,2 by using “… a proprietary windowing algorithm based upon the DFT, as well as dual FPGA/DSP signal processing techniques to adjust the acquisition window size to the fundamental time period of the power waveform. For example, if a 1-s update rate is selected by the user, N4L power analyzers are capable of adjusting the acquisition window size in 500-ns steps around the 1-s selected update rate to ensure that complete cycles are captured.”
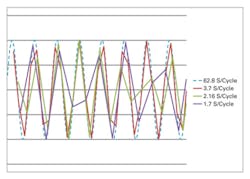
Figure 2 shows waveforms from an Excel experiment that computed RMS values for various over-sampling and under-sampling ratios. Linear interpolation was added to link the sample points. As expected, aliasing is easily seen with the 1.7:1 ratio. The data points were computed as SIN(ROW()/10), which corresponds to 20 π samples per cycle—about 62.8. 50,000 samples were calculated, but only 49,951 (795×20 π) were used to determine the RMS value that was in error by 2.9 ppm compared to (SQRT(2))/2.
With 20 π samples per cycle, there was no danger of correlation at any decimated sample rate, but prime numbers were chosen anyway—the sampling rate was reduced by a factor of 17, 29, and 37 to give ratios of 3.696:1, 2.167:1, and 1.698:1, respectively. The corresponding RMS values were calculated for 795 cycles with errors of 34.2 ppm, 3.7 ppm, and 84 ppm.
Accuracy
It’s easy to see how the interaction between sampling rate and acquisition window time can affect accuracy, especially if the sample rate is relatively low. As the acquisition window is made smaller, the relationship between the asynchronous samples and the individual signal cycles has less time to average. In other words, some cycles will have one more sample than others. Synchronizing the sampling rate to the fundamental frequency or increasing the sample rate minimizes the error.
An N4L application note3 succinctly deals with accuracy: “While the digital design of any digital instrument is clearly important, the accuracy of all these instruments is dictated by the analog design and calibration.” In particular, the capacitance of voltage inputs and the inductance of current inputs limit achievable performance.
Nevertheless, how the digitized data is analyzed also makes a difference. According to the PPA3500 datasheet, N4L selected the DFT for signal decomposition because it is not restricted to the 2n sample window size as is the FFT. As a result, the DFT is capable of minimal leakage without the need for error-prone window filtering functions.
Current shunt design is the subject of another N4L application note.4 The company has developed a wideband planar shunt that features a high degree of magnetic field cancellation and yet is relatively simple to construct. According to reference 4, the shunt inductance is about 250 pH, much less than several competing shunts. This very low value contributes to negligible impedance change vs. frequency up to at least 1 MHz as well as minimal phase change.
Coaxial designs also achieve very good magnetic field cancellation as is evident in the performance of Fluke’s A40B series of precision current shunts for use with current from 1 mA to 100 A. These are metrology-grade shunts with approximate inductances of 1.4 nH for a 20-A shunt, 550 pH for 50 A, and 300 pH for 100 A. These values were calculated from the nominal resistances and the maximum 1.25 degree typical phase displacement at 100 kHz.
Built-in current shunts are well suited to typical power analysis applications but generally do not have this level of performance. For example, the Tektronix PA1000 power analyzer specifies typical RMS current measurement accuracy as ±0.1% of reading ± 0.1% of range ± 0.02% x F(kHz) of reading. So, for the 10-A range at 100 kHz, assuming a 5-A reading, the worst-case error is 5 mA + 10 mA + 100 mA = 115 mA or 2.3% error.
Yokogawa’s WT3000E Series specifies the impedance of the 2-A input module as 500 mΩ + 70 nH and 5.5 mΩ + 30 nH for the 30-A module. For the 30-A module on the 10-A range, the maximum error is listed as 0.012% x F(kHz) of reading + 0.2% of range. So, for the 10-A range, 5-A reading at 100 kHz example, the error is 60 mA + 20 mA = 80 mA or 1.6% error.
Hioki’s PW6001 uses external current probes. For the same example, the instrument’s basic current accuracy specification is 0.01% x F(kHz) of reading + 0.2% of range. To that, you need to add the probe’s accuracy. The 50-A precision current probe accuracy is 2% of reading + 0.05% of range. The probe by itself contributes 100 mA + 5 mA = 105 mA or 2.1%.
To put the importance of a shunt’s frequency response into perspective, the N4L PPA3500 has a built-in 30-A shunt, and the current accuracy is specified as 0.04% of reading + 0.1% of range + 0.005% x F(kHz) of reading + 900 µA. For the 10-A range, 5-A reading example, the error is 2 mA + 10 mA + 25 mA + 0.9 mA = 37.9 mA or 0.76% error.
In all the calculations, the error can be minimized by choosing a measurement range that causes the input to be as close to full scale as possible. If each instrument had a 5-A range, the PA1000, WT3000E, PW6001, and PPA3500 errors would reduce to 2.2%, 1.4%, 2.05%, and 0.66%, respectively.
Instrument choices
If you really need to make accurate high-frequency power measurements, your choice of instruments is relatively small. On the other hand, if you’re more interested in finding an analyzer with good accuracy at the usual AC power frequencies, there are lots of models available.
Power quality analyzers address applications such as voltage and current transient studies, fault recording, inrush, motor testing, harmonic analysis, distortion analysis, and demand/energy/load studies. They provide many of the same measurements as power analyzers, but the emphasis is different.
Dranetz HDPQ 16-bit analyzers use 512 samples/cycle for both voltage and current at 50 Hz and 60 Hz. The Explorer 400 model in the series also supports 400-Hz monitoring and capture of transients as fast as 1 µs. Displayed quantities include real, apparent, and reactive power; power factor; displacement power factor; demand in W; and energy in Wh. Distortion is an important power quality indicator and expressed as total harmonic distortion and individual harmonic amplitude through the 63rd for current and the 127th for voltage.
Summit Technology’s PK45014 PowerSight PS4500 power quality analyzer features continuous and simultaneous analysis of harmonics, transients, RMS V and I, power, and power quality. This handheld instrument has four current inputs and three voltage inputs, calculates harmonics to 3,900 Hz, communicates with your PC via Bluetooth, and boasts a CAT IV safety rating.
The Model PQ3470 three-phase power and harmonics analyzer from Extech also is handheld and includes a large dot-matrix, sun-readable, graphical, backlit LCD. Current input is via a selection of clamp-on probes or current transformers (CTs). Up to 35 parameters are available including V phase-to-phase and V phase-to-ground; kW, kVA, kVAR, and power factor per phase; and energy—kWh and kVAh.
Combining logging and power quality analysis, Hioki’s PW3198 analyzer provides monitoring for several weeks to catch infrequent dips, sags, and swells. Applications up to three-phase, four-wire are supported by four V and four I inputs (via clamp-on probes) for 50-Hz, 60-Hz, and 400-Hz fundamental frequencies. RMS measurements are refreshed each half-cycle and use a 200-kHz sampling rate. Transients are defined as containing frequencies between 5 kHz and 700 kHz and are captured with a 2-MHz sampling rate. Active power accuracy is specified as ±0.2% of reading ±0.1% of range + clamp-on sensor accuracy.
If you need to investigate power quality problems and also are concerned about ground and insulation resistance, Amprobe’s Model DM-III Multitest F power quality recorder may be useful. In addition to ±1% reading + two digits active, reactive, and apparent power accuracy, capabilities include ground resistivity measurements from 0.6 Ωm to 0.1 kΩm as well as insulation resistance measurements up to 1,999 MΩ with a 1-kV DC test voltage. A 3,000-A flexible 7-inch diameter CT is supplied as standard, and both 1,000-A and 100-A clamp-on CTs are optionally available.
Summary
Several types of power measuring instruments exist, and it’s important to choose the right type for your application. Power quality analyzers generally deal with standard supply frequencies and highlight harmonics and anomalies such as dropouts, sags, and transients. These analyzers also can help determine the amount of power factor correction that is optimum in an industrial setting.
When variable frequencies are involved and especially if the overall efficiency of an electromechanical system must be measured, a power analyzer (as distinct from a power quality analyzer) is needed. These instruments handle VFD applications from single-phase through six-phase plus motor RPM and torque.
References
- Fonstad, K., Variable Frequency Drives and Motor Insulation Stress, ABB, White Paper, August 2011.
- Efficiency Measurement of Traction Motors, Newtons4th, Application Note 32, January 2016.
- Expanded Nyquist Sampling Theory, Newtons4th, Application Note 31, January 2015.
- Innovative shunt design techniques optimise power measurement accuracy, Newtons4th, Application Note 12, January 2012.
For more information


