I-V characterization of solar cells and panels using a source-measure unit
The focus for researchers and manufacturers of solar or photovoltaic cells and panels is finding ways to improve cell efficiency and maximize energy extraction. To help achieve these goals, electrical characterization of the cell as well as photovoltaic materials is an important part of research and development as well as during the manufacturing process.
Current-voltage (I-V) characterization of a cell provides insight into important parameters about a cell’s performance, including its maximum current (Imax) and voltage (Vmax), open-circuit voltage (VOC), short-circuit current (ISC), and efficiency (η). These I-V characteristics can easily be generated using a source-measure unit (SMU), a test instrument that can source and measure both current and voltage. Because SMUs have four-quadrant source capability, they can sink the cell current as a function of an applied voltage.
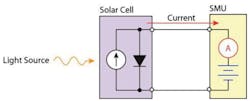
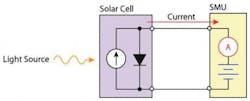
Figure 1 shows the use of an SMU instrument for I-V characterization of an illuminated solar cell. Since current only starts to flow when a load is connected to the output of an illuminated solar cell, the SMU is serving as the load in this configuration. As a result, the measured current is negative.
The solar cell
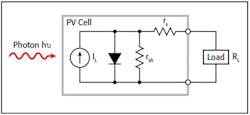
A solar cell may be represented by the equivalent circuit model shown in Figure 2, which consists of a light-induced current source (IL), a diode that generates a saturation current, series resistance (rs), and shunt resistance (rsh). The series resistance is due to the resistance of the metal contacts, ohmic losses in the front surface of the cell, impurity concentrations, and junction depth. The series resistance is an important parameter because it reduces both the cell’s short-circuit current and its maximum power output. Ideally, the series resistance should be 0 (rs = 0). The shunt resistance represents the loss due to surface leakage along the edge of the cell or to crystal defects. Ideally, the shunt resistance should be infinite (rsh = ∞).
If a load resistor (RL) is connected to an illuminated solar cell, then the total current becomes
I = IS (eqV/kT)-1)-IL
where
IS = current due to diode saturation
IL = current due to optical generation
As noted previously, several parameters are used to characterize the efficiency of the solar cell, including the maximum power point (Pmax), the energy conversion efficiency (η), and the fill factor (FF).
These points are shown in Figure 3, which shows a typical forward bias I-V curve of an illuminated solar cell. The maximum power point (Pmax) is the product of the maximum cell current (Imax) and the voltage (Vmax) where the power output of the cell is greatest. This point is located at the “knee” of the curve.
The fill factor (FF) is a measure of how far the I-V characteristics of an actual solar cell differ from those of an ideal cell. The fill factor is defined as
Imax Vmax
FF= _____________________
ISCVOC
As defined, the fill factor is the ratio of the maximum power (Pmax = ImaxVmax) to the product of the short circuit current (ISC) and the open circuit voltage (VOC). The ideal solar cell has a fill factor equal to one but losses from series and shunt resistance decrease efficiency.
Another important parameter is the conversion efficiency, which is defined as the ratio of the maximum power output to the power input to the cell:
Pmax
η = _____
Pin
where
Pmax = the maximum power output (W)
Pin = the power input to the cell defined as the total radiant energy on the surface of the cell (W)
Forward-biased I-V measurements
Forward-biased I‑V measurements of the solar cell are made under controlled illumination. The SMU is set up to output a voltage sweep and measure the resulting current. For this measurement, the voltage source is swept from V1 = 0 to V2 = VOC. When the voltage source is 0 (V11 = ISC). When the voltage source is an open circuit (V2 = VOC), then the current is equal to zero (I2 = 0). The parameters VOC and ISC can in turn be derived from the sweep data. Figure 4 shows the I-V curve of an illuminated PV panel generated by an SMU.
Conversion efficiency (η) can be calculated if the power input to the cell is known and current density (J) can be derived based on the area of the cell.
Reverse-biased I‑V measurements
The leakage current and shunt resistance can be derived from the reverse-biased I‑V data. Typically, the test is performed in the dark. The voltage is sourced from 0 V to a voltage level where the device begins to break down. The resulting current is measured as a function of the voltage.
Depending on the size of the cell, the leakage current can be as small as picoamps. When making these very sensitive low-current measurements (nanoamps or less), you may need to use low-noise cables and place the device in a shielded enclosure to shield it electrostatically. One method for determining the shunt resistance of the PV cell is from the slope of the reverse-biased I‑V curve, as shown in Figure 5.
A solar cell or panel is connected to an SMU as shown in Figure 6. A four-wire connection is made to eliminate the effects of the lead resistance. When connecting the leads to the solar cell, the Force LO and Sense LO connections are made to the cathode terminal. The Force HI and Sense HI connections are made to the anode. The connections should be made as close as possible to the cell to prevent the resistance of the solar cell’s terminals from affecting measurement accuracy.
Automating I-V measurements
Many SMUs can be remotely controlled using test scripts through a LAN, USB, or GPIB interface. In this example, automated I-V characteristics testing was performed on a polycrystalline silicon solar panel. The SMU was programmed to sweep voltage from 0 V to 20 V in 115 steps and to measure the resulting current in a four-wire configuration. The results of graphing the I-V characteristics of this cell are shown in Figure 7. Notice the test on the solar panel was executed with light (Light ON) and in the dark (Light OFF). As previously discussed, the measured current in the “Light ON” graph is negative because the SMU is sinking current. If desired, the curve can easily be inverted in the spreadsheet.
In addition to automating I-V measurements, some SMUs feature a user-customizable interface to display the derived maximum power, short-circuit current, open-circuit voltage, or other user-derived calculations on a single screen (Figure 8) for faster and easier analysis.
Conclusion
Measuring the electrical characteristics of a solar cell is critical for determining the device’s output performance and efficiency. Key measurements include maximum current and voltage, open-circuit voltage, short-circuit current, and efficiency. SMUs can simplify solar cell testing by automating the I‑V measurements and pulling together results for easy display and analysis.
About the author
Mary Anne Tupta is a senior applications engineer in the Keithley Instruments Product Line at Tektronix in Cleveland. She has a M.S. degree in physics and a B.S. degree physics/electronic engineering from John Carroll University. Tupta has been an applications engineer at Keithley since 1988. [email protected]

Comment About the Article
To join the conversation, and become an exclusive member of Electronic Design, create an account today!

Leaders relevant to this article: