A large lot of plastic-packaged ICs is on its way to surface-mounting. The components have passed electrical inspection, where those having functional defects were removed. They have passed optical inspection to find those components having external defects, and they have undergone mass acoustic imaging to find those components having internal structural defects. The survivors of these tests will be surface-mounted and perform reliably for their expected lifespans. What could go wrong?
What could go wrong is an abrupt in-service failure due to an inconspicuous change in the packaging material from that used in previous lots. What typically happens is that the maker of the components has for some reason—cost, availability, processing characteristics, or perhaps even unknowingly—received a modified or altogether different encapsulant material from its suppliers to package the die. A discreet change will not show up in the electrical inspection, optical imaging, or acoustic imaging mentioned above. The changed thermal, mechanical, and adhesive properties of the mold compound, however, can lead to unexpected damage during reflow or in service.
Specifically, these components will differ from those in previous lots in two material characteristics: the acoustic impedance of the mold compound and the acoustic attenuation of the mold compound. An acoustic micro imaging tool such as those in Sonoscan’s C-SAM lineup can measure each of these values quickly and easily.
Measuring acoustic impedance
Suppose that ultrasound travels through a given mold compound at a speed of 2,950 meters per second, and that the mold compound has a density of 1.6 grams per cubic centimeter. Acoustic impedance is the product of these two numbers, expressed in MegaRayls. This mold compound will have an acoustic impedance of 4.72 MegaRayls. The acoustic impedance of mold compounds ranges from about 2.0 to 8.0 MegaRayls. Typically a higher number of filler particles results in a higher acoustic-impedance reading.
The C-SAM tool measures the acoustic-impedance value of a mold compound in one step, without having to measure the acoustic velocity and density separately. The tool comes with a reference sample, whose acoustic properties are known. Both the reference sample and a part from the incoming lot are tested.
The reference sample is tested first. To perform the test, the tool’s transducer first sends a single pulse of ultrasound through the water couplant to the surface of the reference sample. A low-frequency transducer such as 15 MHz is typically used because its wide spot size gives a more accurate reading by encompassing a larger area of mold compound and filler particles. The pulse strikes the surface of the reference sample and sends back an echo in a few microseconds. The tool’s display reports the sample’s acoustic impedance at that location. Note that the pulse does not need to penetrate into the sample, as it would if the transducer was being used for the imaging of internal structural features.
The acoustic-impedance value of a material does not change with the frequency. A material that has an acoustic impedance of 6.0 at 15 MHz will have the same acoustic impedance when a 230-MHz transducer is used. Measuring the acoustic impedance with a 230-MHz transducer would be time-consuming and have a more localized reading, however, because the focal spot size of the transducer is so much smaller. The smaller spot will be more sensitive to surface texture and localized (uneven) spatial distribution of filler particles in the encapsulant.
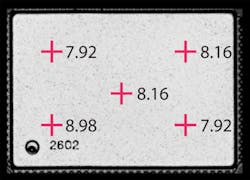
A common sequence for the test is to interrogate a part in five locations on the part’s surface, one near each corner of the part and one in the center. The locations are not rigidly fixed; the goal is simply to collect the acoustic-impedance value from five widely separated locations. Places where the surface has lettering or markings are avoided because they will yield inaccurate values for the mold compound.
Figure 1 shows the readings at five locations on a plastic package surface. To get an initial Acoustic Impedance value, the five readings are averaged; here the average is 7.92. There is usually some variation among the five readings because of the variable distribution of filler particles in the mold compound. If the variation among the five readings is too great, one or two additional locations on the sample may be tested to make the average acoustic-impedance value more representative of the mold compound. The 8.98 value at lower left, however, although significantly higher than the other four values, did not necessitate the adding of locations. It is worth pointing out that there may be some systematic variations in acoustic impedance that depend upon geometry of the part and the location of the component in the mold relative to the “liquid” injection site.
Typically, a few more parts from the incoming lot are imaged in the same way to obtain a good statistical set of data compared with a reference sample of the same type. If the parts in the incoming lot are statistically close in their acoustic-impedance values to the values of previous lots, then this lot probably uses the same mold compound, and it is unlikely that that other mold compound characteristics such as thermal behavior have changed. But to be more certain, a second test is advisable.
Acoustic attenuation
A C-SAM tool can quickly and directly measure the acoustic attenuation of the mold compound used on the incoming part. Acoustic attenuation results from the absorption and scattering of ultrasound as it travels through a given material. It is measured in decibels lost per millimeter. The C-SAM test sends a single pulse into the sample part, and it measures the depth from which the echo has been returned and the amplitude of the return echo in order to determine the dB loss per mm.
Acoustic attenuation is almost always unrelated to acoustic impedance. An incoming part that matches earlier parts in both acoustic impedance and acoustic attenuation is likely the same in all material attributes as earlier parts.
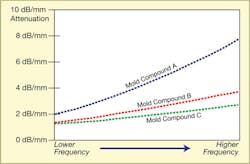
Figure 2 shows the results from acoustic-attenuation testing of three mold compounds. Mold compound A is attenuated at 2 dB/mm at a low frequency such as 15 MHz, but rises gradually to a loss of nearly 8 dB/mm at 50 MHz. Depending on the thickness of the mold compound, it may be hard to make a satisfactory image from an interface deep within the part. Mold compound C, though, creates a loss of only 2 dB/mm even when a pulse at a high ultrasonic frequency is passing through it.
Both of these C-SAM tests are quick to carry out. Typically the tests reveal that the incoming lot of parts is essentially identical to previous lots. This is not an absolute guarantee that no material change has occurred, but it makes the likelihood of such a change unlikely.
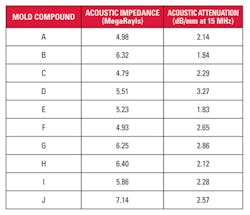
Table 1 displays the average acoustic impedance and acoustic attenuation values for 10 lots of plastic-encapsulated ICs. It is not difficult to spot pairs of mold compounds having very similar values in both categories. Mold compounds A, C, and F have very similar values in both columns. What a careful technician is looking for is a lot of parts where one or both values have departed from their historic averages. If mold compound D, for example, has always had an acoustic attenuation between 2.0 and 2.1 dB, it is worthwhile looking for the cause and consequences of the current 3.27 reading.
Questions also arise when the differences among the five or more readings on a single part are extreme—say, an acoustic impedance of 3.8 at one location and 6.5 at another location. How dangerous is the material inhomogeneity that these numbers suggest?
Sonoscan’s laboratories often image parts on both the front and back surfaces because a substantial difference in average acoustic impedance between the two surfaces can be a sign that the part is counterfeit due to blacktopping of the top surface.
Most acoustic verifications of mold compounds probably indicate that there has been no change between the current lot of a given part and its predecessors. This information lets assembly proceed with little worry about surprises.
The greatest value of acoustic verification takes place when the two tests reveal the presence of a new material in a mold compound, and it permits testing to take place before blindly using the parts having the new materials in assembly. The cost savings in avoiding damage during assembly, or in using counterfeit parts, are likely to be substantial with respect to both monetary and reputational repercussions.
About the author
Tom Adams is a freelance writer and photographer who has written more than 500 articles for semiconductor and microelectronics trade magazines.
About the Author
Tom Adams
Consultant, Nordson SONOSCAN
Tom Adams is a professional science writer based in New Jersey.


