Sensor, Laser, Magnetic Field Map Current-Stream Distribution in Conductors
What you’ll learn:
- Why there’s a need to assess current-flow distribution.
- How an arrangement was made for the measurement using a controlled magnetic field, laser-induced current flow, and a subtle physics-materials effect.
- The results of the current-flow analysis and measurements.
If you need to determine current flow in a conductor, there are several contact and non-contact options: multimeter, sense resistor, Hall-effect device, or transformer, to cite a few. But what if you need to study the actual current-flow patterns and distribution with the conductor? That’s a far more challenging scenario.
You may think this is a “don’t care” situation and in many cases, that’s so. But just as an RF signal in a wire sees sharp turns as a disruptive impedance bump, DC flow may also see resistive bumps as those electrons struggle to make the turns resulting in losses and self-heating. (It’s been known theoretically for about 80 years that when electrons travel around bends, they tend to heat up because their flow lines get “squished” locally.)
Imaging Streamlines with an Electrofoil
To address this issue, a research team led by Nathaniel M. Gabor, professor of physics and astronomy at the University of California (Riverside), has imaged bunching of “streamlines” of electrical current by designing an “electrofoil.”
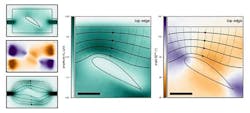
This new type of device allows for the contortion, compression, and expansion of streamlines of electric currents similar to the way airplane wings contort, compress, and expand the flow of air (Fig. 1). He noted, “While it is easy to image the flow of air by using, say, streams of smoke or steam in a wind tunnel, imaging the streamlines of electric currents is far more difficult.”
1. The team’s concept was to create microscopic diversions and channeling of the electron flow—analogous to airfoils—and then instrument an arrangement, allowing them to observe the current streamlines.
Gabor said the team combined laser imaging with novel light-sensitive devices to come up with the first images of photocurrent streamlines through a working device. The team designed the electrofoils as little wing shapes fabricated in nanoscale devices that make the electrons flow around them, like how air molecules flow around an airplane wing.
“We wanted a shape that could give us different rates of turning, something with a continuous curvature to it,” noted Gabor. They forced the current to flow around the electrofoil, which offers different angles of flight. The sharper the angle, the more the compression of the flow lines as the electrons behave like incompressible liquids.
Running the Tests
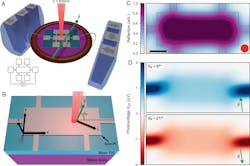
In their experiments, Gabor and his colleagues used a microscopy method that uses a uniform rotating magnetic field to image the streamlines of photocurrents (currents created by impingement of light) through ultra-thin devices (Fig. 2). These are made of a layer of platinum on yttrium iron garnet (YIG), an insulator that allows for a magnetic-field effect when a thin layer of platinum is glued to it. By controlling the magnetic field, they could control the current.
2. Photocurrent streamline microscopy of micromagnetic heterostructure devices: (A) Schematic of the magnetic heterostructure Hall bar device and measurement. The green arrow indicates the magnetic field direction. Inset: two-terminal photovoltage configuration; all side contacts are grounded. (B) Schematic of Device 1: a conventional Hall bar defined in ultra-thin Pt (5 nm thick) sitting atop a ferrimagnetic layer of YIG (80 nm) with a substrate of GGG (300 nm). Laser illumination λ = 830 nm; average power density 3.6 MW/cm2. Charge current jc is perpendicular to the applied magnetic field B. θB is the angle between the magnetic field, and the axis defined by the photovoltage probes (x axis). (C) Reflection map of Device 1: The red circle indicates the full width at half maximum (FWHM) of the beam spot. (Scale bar, 50 μ.) (D) Magnetic field-dependent photovoltage Vph maps at θB = 97°, 277°. The B-field direction is indicated by green arrows. Magnetic field magnitude B = 0.52 T for all measurements.
To generate a photocurrent in a desired direction, the researchers directed a laser beam on YIG, with the laser serving as a local heat source. Due to a phenomenon known as the “photo-Nernst effect,” the photocurrent direction is controlled by the external magnetic field. (This effect is the photocurrent generated uniformly along the free edges of a conductor having a perpendicular magnetic field.)
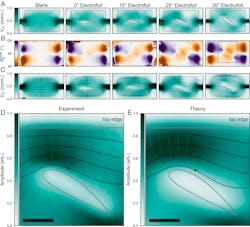
Using an imaging technique in this electronic “wind tunnel,” the researchers examined the fluid-like properties of electronic current (an incompressible, irrotational fluid) through nanoscale devices. They found that photocurrent streamlines display contortion, compression, and expansion behavior depending on the shape and angle of attack of the electrofoil devices (Fig. 3).
3. Contortion, compression, and expansion of photocurrent streamlines in a micromagnetic wind tunnel: (A) Images of the sinusoidal fit amplitude Vm at all points in space for five different magnetic heterostructure devices. The blank device (far left) is a two-terminal rectangular plane (500 μm × 250 μm2). Electrofoil devices are two-terminal planes from which Pt is removed in the shape of aerodynamic airfoils with increasing angles of attack (labeled above), as outlined with solid lines. (B) Images of the angular phase shift of the fit θB (max) relative to θB = 0° at all points in space for each of the electrofoil devices. (C) Continuous flow-field interpolation of the photocurrent density vector field in B overlaying the sinusoidal fit amplitude Vm at all points in space. Interpolated flow lines are weighted by the amplitude Vm. (D) Zoomed-in photocurrent streamline image and Vm(x, y) amplitude for the 35° electrofoil device. (E) Theoretical simulation of S and r for the 35° electrofoil device. Solid black lines indicate current flow. (Scale bar, 50 μ.)
Imaging resolution spanned over an order of magnitude in spatial scale. Gabor noted that “photocurrent streamline microscopy is a robust new experimental tool to visualize a photocurrent in quantum materials. This tool helps us look at how electrons behave badly.”
The work, from theoretical analysis through test results, is detailed in their paper “Mapping the intrinsic photocurrent streamlines through micromagnetic heterostructure devices” published in the Proceedings of the National Academy of Sciences (PNAS). It’s also posted as a 7-page pdf here.
About the Author

Bill Schweber
Contributing Editor
Bill Schweber is an electronics engineer who has written three textbooks on electronic communications systems, as well as hundreds of technical articles, opinion columns, and product features. In past roles, he worked as a technical website manager for multiple topic-specific sites for EE Times, as well as both the Executive Editor and Analog Editor at EDN.
At Analog Devices Inc., Bill was in marketing communications (public relations). As a result, he has been on both sides of the technical PR function, presenting company products, stories, and messages to the media and also as the recipient of these.
Prior to the MarCom role at Analog, Bill was associate editor of their respected technical journal and worked in their product marketing and applications engineering groups. Before those roles, he was at Instron Corp., doing hands-on analog- and power-circuit design and systems integration for materials-testing machine controls.
Bill has an MSEE (Univ. of Mass) and BSEE (Columbia Univ.), is a Registered Professional Engineer, and holds an Advanced Class amateur radio license. He has also planned, written, and presented online courses on a variety of engineering topics, including MOSFET basics, ADC selection, and driving LEDs.


