Pass-by Testing Helps Reduce Train Noise Pollution
What you’ll learn:
- The dynamic range and frequency response required to make sound measurements on passing trains in a variety of environments.
- The methodologies used to analyze the measured data.
- The considerations that factor into making acoustic tests.
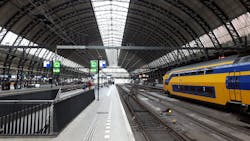
Trains are an essential transportation method worldwide, and it’s estimated that more than a billion people use long-distance and urban rail systems every day to commute. Unfortunately, riders and others are exposed to unpleasant and unhealthy acoustic noise created by these systems.
Noise is generated at all railway locations, including stations, open tracks, and stops. Some sounds are required and useful, such as the use of warning horns when approaching or departing from stops and stations. However, other sounds aren’t useful. As you can probably guess, the greatest single source of train noise is the interaction of wheels with the tracks.
In the Netherlands, DEKRA Rail specializes in optimizing wheel-rail interaction to reduce unpleasant and even harmful noise. DEKRA engineers measure exterior noises, including rolling noise, impact noise, and traction noise. Rolling noise is the main contributor among that group.
DEKRA’s DAQ Needs
To conduct their important work, DEKRA needed a data-acquisition (DAQ) measurement system to replace the older instruments that it was using. The engineers drew up a list of requirements and quickly determined that ease of use was the most important. They wanted to reduce setup time and improve their efficiency. They also preferred a system that could be set up quickly at a wide variety of locations, from the mountains to the suburbs and the middle of a city.
Another mission-critical requirement on their list was that the system had to be triggerable by optical sensors so that the measurement would start when the train passed an exact location. The system should also be capable of calculating derived values from the raw data, and then export all of the data to common formats for detailed offline analysis using third-party and proprietary analysis software.
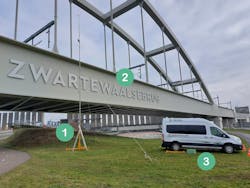
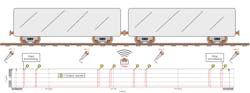
The mobile DEKRA measurement station set up at a railway bridge is shown in Figure 1. A set of microphones is mounted on a vertical rod, with an optical sensor trigger near the top. Engineers can operate and monitor the measurements from the comfort of the Mobile Measurement van.
DEKRA Rail identified DEWEsoft’s SIRIUS DAQ system as the solution that best fit its needs. The small system provides eight high-bandwidth analog inputs compatible with multiple sensors, especially microphones. Dual 24-bit ADCs on each analog input provide a dynamic range greater than 160 dB, which is required for making detailed acoustic analyses. The SIRIUS system meets IEC 61672 requirements for a Class I sound level meter (Fig. 2).
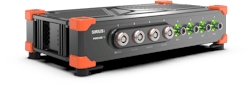
In addition to the high-end analog inputs, SIRIUS has digital inputs compatible with optical sensors. Equally important was the software, and its modules for Octave band analysis, FFT, and sound-level analysis. DewesoftX software can also be extended via C++ scripting, allowing engineers to implement custom calculations.
The system supports measurements in either air or water and can be combined with all other physical measurement parameters, vehicle bus systems, video, GPS, and other math to build a detailed image of the entire measurement. It offers frequency and time-weighted analysis with simultaneous peak-level detection running on a DAQ system featuring real-time calculation of output channels such as Leq, Lim, LE, Lmin, Lmax, classified sound levels, and much more.
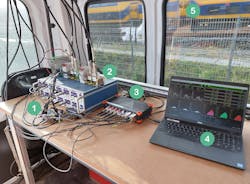
The measurement system inside the mobile DEKRA measurement station is shown in Figure 3. Outside the van’s window, a passing train is visible.
Specific Required Data Results
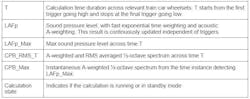
When measuring pass-by noise, DEKRA was interested in a specific set of calculated metrics and spectral results (Fig. 4). The list of required results is updated for each train wheelset following the start trigger. The microphones are placed parallel to the track.
Results are updated at each point marked with a star in Figure 5.
Maximizing Measurements
The engineers decided to export captured data automatically as text files so that they could generate reports using their internally developed reporting tools and templates. In this way, the data captured by the DEWEsoft system could be better compared to all of the historical data captured by the older system (Fig. 6).
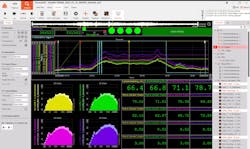
In a matter of minutes, DEKRA engineers were able to create the ideal display for this application. Referring to Figure 6, the four green indicator lamps near the top of the display show that all four wheelsets have been detected by the triggers and that calculations are running.
Looking closer at the screen, the top graph shows the triggers and signal levels over time. The bottom left section shows four sets of A-weighted noise spectra, where the darker shades reveal RMS values over the calculated time T, and the lighter shades show the instantaneous spectra at the time the LAFp_Max was detected.
The bottom right grouping of digital meters shows the different sound pressure levels, calculation time (T) used, and the number of train wheelsets detected. To be more precise:
- Row 1: LAFp (top row)
- Row 2: LAFp_Max
- Row 3: LAeq_T
- Row 4: T
- Row 5: Detected wheelsets
Custom Scripting
DEWEsoft created a software setup using DewesoftX’s built-in Sound Level Meter module, Octave Analyzer module, and a custom C++ script. This code was written inside DewesoftX using the C++ math module (Fig. 7).
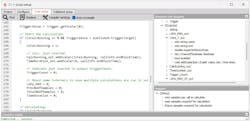
The C++ script was used to ensure that all of the calculations would be done exactly in synchronization with the test trigger start and stop times. It was important to DEKRA that derived output channels could be exported and analyzed just like the analog channels.
Test Automation Using the Sequencer
To save time and improve efficiency, captured data can be exported automatically after each test in a user-selectable format. This process was automated using the Sequencer built into DewesoftX. The “action sequence” starts with loading the test configuration and ends with looping around after exporting the test results (Fig. 8).
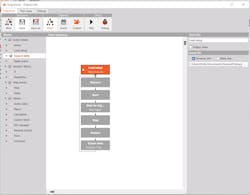
Looking at the blocks from top to bottom, LOAD SETUP causes the desired setup file to load. Then the MEASURE and START action blocks start the measurement and arm the trigger. The system then waits for the trigger signal from the optical sensor. The data is captured and processed in real-time; then the acquisition STOPs automatically. The final blocks export the data to the desired format, and subsequently the whole process loops around automatically, ready for the next test.
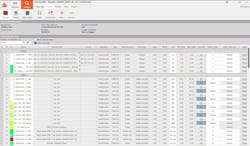
The channels acquired include analog input channels (microphones), a digital trigger channel, the channels derived from the sound module (e.g., A-weighting), and octave bands. Finally, there are numerous outputs from the C++ scripts (Fig. 9).
In addition to having the triggered results calculated and exported automatically, DEKRA engineers also requested the ability to perform post-analysis of the measured data. The post-analysis has two main purposes:
- To quickly validate the automatically determined results,
- To determine additional results based on triggers between specific train wheelsets only
This functionality provided the engineers with a simple way to automatically gather the results while still having the ability to manually recalculate channels as required for specific tests and train car regions. In DewesoftX, the solution was designed so that DEKRA could easily select data regions of specific train wheelsets and recalculate the requested results only based on that data.
DEKRA's DewesoftX System: End Result
DEKRA engineers are pleased with the capabilities and user-friendliness of the new system. Not only can they perform their important work easier and faster, but they have new features and capabilities. The measured data has a much higher bandwidth and dynamic range, and both the time history data and acoustic data are in perfect sync with one another.
About the Author

Grant M. Smith
Grant M. Smith has been in the test and measurement industry for 40+ years, starting as a technician in 1980 and working his way up as an application engineer, where he put together hundreds of solutions for companies like NASA, Ford Motor Company, and many more. He eventually founded the North American division of Dewetron, running it for 20 years until he retired in 2017. He has a broad range of experience with DAQ applications across the automotive, aerospace, power, and industrial sectors.
Today, Grant applies his application knowledge and experience writing about data-acquisition technology for industry leader Dewesoft, and contributing to major industry publications.
Comment About the Article
To join the conversation, and become an exclusive member of Electronic Design, create an account today!

Leaders relevant to this article: