Hardware Emulation for Software Validation (Part 2): Hybrid Emulation and Trace-Based Debug

Download this article in PDF format.
Editor’s Note: Lauro Rizzatti went to Russell Klein, director of engineering at Mentor Graphics and a hardware emulation expert, to learn more about hybrid emulation. This column is co-authored by the two of them.
Hardware emulation continues to prove itself as a handy tool for hardware/software co-verification, where the objective is testing the integration of hardware and software. Part 1 of this series looked at how JTAG debug probes let software developers debug software running on a design in the emulator. Part 2 looks at some of the more advanced techniques for running and debugging software in hardware emulation.
The most common way for developers to debug software in emulation is to use a JTAG probe (Fig. 1). While this is a capable debug environment, it’s not likely to be used to start software development earlier. Even with the benefits of virtualizing the JTAG connection described in Part 1 of this series, it’s too slow and expensive to be used as a practical development environment for most software developers.
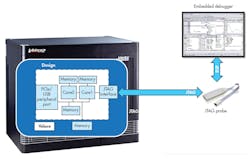
1. A common method for software debug uses a physical JTAG probe. (Source: Mentor Graphics)
Hybrid Emulation
One technique used to address the speed issue is “hybrid emulation.” Hybrid emulation combines a virtual machine for modeling the processor and memories with the remainder of the design in register-transfer-level (RTL) code in emulation. The time domains for the virtual machine and the emulator are separated to allow the virtual machine to advance faster than the RTL portion of the design.
The virtual machine, which could be based on the open-source processor emulator (QEMU) or a commercial model such as the ARM Fast Model (AFM), will run at 100- to 200-million instructions per second (MIPS) or faster. With a design fully in RTL executing in an emulation system, the processor usually runs at only a couple of megahertz, which gives a throughput of only about four or five MIPS. At that speed, a Linux boot would take between 45 and 90 minutes –– too slow for practical software development.
Using the virtual machine, Linux will boot in under two minutes. While not quite real-time, it’s faster than either full RTL emulation or field-programmable gate-array (FPGA) prototypes.
The RTL code in this arrangement is in the emulator and continues to run at a couple of megahertz. If the system being emulated is software-bound, that is, limited in throughput by the software activity, there will be a significant speed up. If the system is hardware-bound, the performance of the RTL code will dominate, and there will not be much of a performance boost. Software-development tasks tend to be software-bound; therefore, hybrid emulation is an ideal technique for making emulation accessible to the software team.
In hybrid emulation, events are passed back and forth between the emulator and the virtual machine as needed or on specific time boundaries. Hybrid emulation takes advantage of the natural event synchronization between hardware and software, freeing the virtual machine to advance ahead of the RTL code for higher performance at a cost.
Because time domains are free-running, there’s no way to determine the overall system performance. Further, since the processor model is abstract, the exact timing of the software execution is unknown. While hybrid emulation is great for fast functional verification of hardware and software, a full RTL design is needed for verification of performance, throughput, and response times.
Trace-Based Debug
There is an approach for verification of performance-related issues on full RTL design. While JTAG probes can debug a full RTL design as described in Part 1 of this article, they introduce millions of clock cycles of debug activity, which brings into question any conclusions about performance using a JTAG debugger.
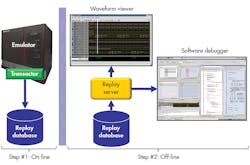
2. Trace-based software debug offers detailed, accurate performance analysis and debug. (Source: Mentor Graphics)
A trace-based debug approach is needed for detailed, accurate performance analysis and debug (Fig. 2). Using the capabilities of the emulator that allow full visibility into the processor cores, the activity of the processors in the design can be traced to a degree not possible with other trace technologies. This trace can be used to calculate the full state of the processor and its surrounding memory for an entire emulation run.
The trace can be used for a number of purposes. One is to create a “virtual target” that a debugger can connect to and virtually “run” the program. Since the state of the processor and memory are calculated from a trace of a prior execution of the system, it’s not running. Rather, it’s being “replayed.” Think of it as digital video recorder (DVR) for software debugging.
Debugging using a trace through the virtual target isn’t a matter of staring at a list of instructions executed. It delivers the full capability of a symbolic debugger and shows the original source code, disassembly, processor registers, memory, variables, and program stack.
The response time of a debugger connected to the emulator is limited by the performance of the JTAG channel –– eight seconds for physical JTAG probe debugging a processor such as an ARM Cortex A57 processor or approximately two seconds for a virtual probe. The virtual target responds in about 20 ms.
The virtual target can “run” the program at an effective rate of about 50 MIPS, compared to a few MIPS when connected to the emulator, and around 10 MIPS for an FPGA prototype. Since this debug view is operating off a trace, it can run the program backward as well as forward. Improvements in performance, responsiveness, and debug capability have an impact on software-developer productivity.
It’s important to note that this trace-based debug usually is available sooner in the design cycle than a JTAG connected debugger. JTAG probes use the debug logic in the design, like ARM’s CoreSight, to connect to the processor and can’t be employed until the debug logic is designed, tested, and properly configured for use. The trace-based debug can be used as soon as the processor is executing its first instruction.
Since the trace isn’t intrusive to the program being run, it’s ideal for correlation with hardware activity. The activity of the processor from this trace is able to be correlated with hardware waveforms collected during emulation. This correlation works both ways. A point in the waveform can be selected and the trace on the processor will show what line of code was being run at that time. Or a line of code can be selected and the corresponding location in the waveform will be shown.
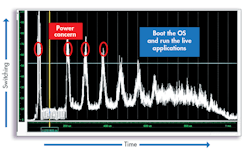
3. The activity plot highlights a design’s switching activity.
This correlation can be done with an activity plot. The activity plot in Figure 3 shows a sparse sampling of the switching activity in the design over time. While this isn’t an absolute or precise measurement of power consumption, higher switching activity is an indication of higher power consumption. This allows for a correlation between software activity and power consumption that’s not possible with other debug techniques.
The trace can be converted into a database of events associated with the software execution. For example, it’s possible to extract all memory read and write operations from the trace. These can be searched for problems, such as a write operation to memory followed by a read at the same address that returns a different value than was written earlier. This would indicate an issue with the memory system –– probably a bug worth investigating.
The same technique can be used to verify the consistency of coherent caches in a system. Cache coherency bugs are notoriously difficult to find and debug. While not well known, most JTAG probes will flush all caches and buffers when they connect to a processor core before any debugging begins, making it difficult to debug cache and cache coherency issues with a JTAG-based debugger.
Finally, the trace can be imported into profiling systems. Since the trace was collected in a non-intrusive manner, no errors are associated with the tracing present in most other profiling and trace data. The trace can be across multiple cores at the same time, so developers can see what the software on all of the cores was doing at any point in time and correlate it with hardware. This helps a developer see detailed, fine-grained interactions between multiple cores and hardware devices and gives insight into synchronization and timing problems that are otherwise difficult to uncover (Fig. 4).
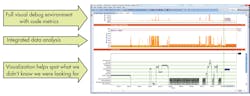
4. The activity data analysis can be shown as a graphical vision.
Bring on the Speed
Hybrid emulation and trace-based debug environments deliver faster performance and better responsiveness than software developers are used to with emulation and JTAG-based debug solutions. JTAG-based debug on emulation, while providing capable debug functionality, is too slow and expensive to consider for “shifting left” software-development work. FPGA prototypes, while still slow and expensive, are considered the standard for starting software development earlier in the design cycle.
Hybrid emulation and trace-based debug are faster than most FPGA prototypes used today. The cost per hour, or what accountants would call “allocated costs,” can be lower for these debug approaches with emulation than with FPGA prototypes. For hybrid emulation, the performance increase means that there will be fewer hours on the emulator than would be needed on an FPGA prototyping system to do the same work.
For trace-based emulation, the program is run from start to finish and traced, and then the debug work is performed offline. That means the number of hours on the emulator is a fraction of the total debug hours needed by the software-development team. The slow task of debugging is shifted off the emulator and onto commodity workstations, freeing up the emulator for other verification tasks.
Hardware emulation continues to evolve with new features, capabilities, and use models. Advances and innovations in running and debugging software in the context of emulation are making the emulation platform a viable and cost-effective way to begin software-development tasks earlier, reducing overall project schedule and reducing risks.
About Russell Klein
Russell Klein is a Technical Director in Mentor Graphics' Emulation Division. He holds a number of patents for EDA tools in the area of SoC design and verification. Klein has more than 20 years of experience developing design and debug solutions that span the boundary between hardware and software. He has held various engineering and management positions at several EDA companies.

About the Author

Lauro Rizzatti
Business Advisor to VSORA
Lauro Rizzatti is a business advisor to VSORA, an innovative startup offering silicon IP solutions and silicon chips, and a noted verification consultant and industry expert on hardware emulation. Previously, he held positions in management, product marketing, technical marketing and engineering.
Comment About the Article
To join the conversation, and become an exclusive member of Electronic Design, create an account today!

Leaders relevant to this article: