Instruments and the Cloud: 5 Tips to Automate Your Lab
This file type includes high-resolution graphics and schematics when applicable.
In a world of increasingly complex products and faster release cycles, the benefits of leveraging the results of our instruments used in test and measurement have never been greater. Development of tools for storing measurement results, analyzing data, and automating reports requires non-trivial software programming in order to operationalize and automate them. In addition, many of the daily tasks required to obtain accurate insight and analysis remain manual.
Cloud computing coupled with modern-day web browser capabilities represents a tool in the engineer’s arsenal to automate lab instruments, accelerate time to market, and build better products.
How It Works
Cloud computing provides a near infinite storage and compute platform for collecting data from instruments, storing configurations, sending configurations to instruments, and performing analyses. GradientOne Inc. is one company that offers these capabilities via software as a service (SaaS).
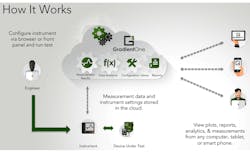
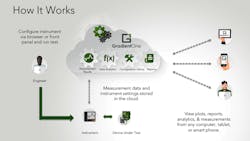
Steps in an example workflow (Fig. 1) are:
1. The engineer configures the instrument via the front panel, a web browser, or loading a previously saved configuration from the cloud.
2. Test data, measurements, and configuration information get sent to the cloud for storage and cataloging.
3. Test results and reports are accessible by any device, anywhere in the world.
Below are five tips you can use to immediately start taking advantage of these capabilities:
1. Automatically store measurement results
I once met with an automotive engineer who told me he lost a week of his team’s time because he incorrectly transcribed a measurement value from the oscilloscope to his notepad (and subsequently to an Excel spreadsheet he distributed internally). His team spent several days trying to re-create the measurement that delivered the incorrect value, only to later realize it was a simple transcription error.
Writing measurements down is the most basic way to record data; more sophisticated ways include storing the results to a USB drive, installing a software program, or programming the instrument to output the results over the network. Programming requires a good foundation of software development skills, insight into the instrument drivers, and ultimately, a place to put the data after its extracted from the instrument.
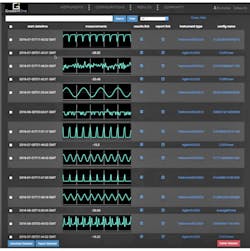
Cloud computing can be used to automate the data capture each time a measurement is triggered. The resulting instrument data, measurements, and configuration are automatically stored in the cloud and available on a web browser, tablet, or mobile device. The results are catalogued and indexed to allow for search and filtering to help find exactly the data you’re looking for (Fig. 2). No need to maintain a database, write database query code, or program the instrument drivers to store the code.
2. Scalable analytics
An R&D engineer friend who was working on a medical device wanted to analyze specific channel power levels from four different generations of products. First he had to find the data (was it on a test engineer’s laptop? the production database?), then extract the specific channel info and subsequently load it in a spreadsheet. But the spreadsheet wasn’t able to handle the number of rows he needed to have analyzed.
The near-infinite storage and processing capabilities provided by cloud computing solve this problem. Cloud computing gives the user the ability to execute a work flow such as:
• Search for a particular set of results: “Ch A frequencies 902 – 904 Mhz”
• Specify basic type of analyses desired: “Basic Statistical Analysis of Max/Min/Mean”
• Specify advanced analyses:
- “Highlight Results > 1 Standard Deviation from the Mean”
- “Perform FFTs”
- “Convert to MATLAB”
• Create summary report and export as PDF and CSV
Performing these types of analyses on millions of datapoints, converting into different formats like MATLAB or CSV, occurs in a matter of seconds with a few simple mouse clicks.
3. Create your own automated measurements
Cloud computing provides several of the required building blocks to develop and create custom automated measurements. One example is testing capacitor equivalent series resistance (ESR, which is simplified with GradientOne—attach the probe leads, select the measurement cap_esr, and hit “go,” and you have your result.
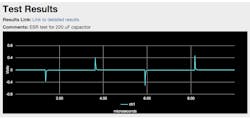
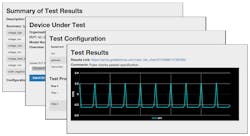
In the example in Fig. 3, a user selects the Tektronix MDO3012, which has an integrated function generator with its oscilloscope. The function generator is issuing a square wave at 1 V p-p, 220 kHz. The scope captures the signal, transmits the settings and waveform to the cloud (where algorithms calculate the voltage drop across the capacitor), and performs the calculation.
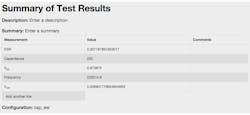
The results of the measurement (Fig. 4), the trace, and the data are stored in an automatically generated report that’s maintained on the server. No need to program via IVI or SCPI. Simply create your instrument settings, store them on the server, and then run them on demand when needed to deliver the required custom measurements and tests.
4. Automate report generation
When it comes time to build a test report, engineers need to collect the data that might be stored in several different places, then conform it with a template, import images, and edit. Cloud computing can be used to automatically generate reports based off the data and configuration issued during an instrument capture (Fig. 5). With cloud computing, automation of report generation features:
• Templates built off collected instrument settings, measurement results, raw data, and trace plots.
• Uploading of pictures of the device under test and lab setup.
• Automatic tracking and incorporation of user comments, feedback, and insight into test results.
• Integration with a customer’s lab notebooks via Google Drive and other cloud platforms.â
5. API access
For the customers who currently maintain automated test systems, plans, and scripts, a well-documented application programming interface (API) provides a simple way to integrate existing environments to the cloud. In turn, they’re able to leverage the automatic recording, data storage, plotting, and configuration management capabilities.
Users may also programmatically access data that’s stored in the cloud for use with custom graphics, analytics, and report-generation applications. Similar to APIs for other web applications, GradientOne’s API uses HTTP(s) and JSON to provide access regardless of which software program is being used to access the data.
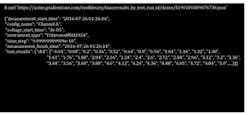
A very simple way to access the data would be to use the curl command available on Windows and Linux computers (Fig. 6), then enter the relevant identifier for the results (in this case it is the “test_run_id”). The results are now resident locally on your system to incorporate into an application like MATLAB or Python program for performing other analyses important to your organization.
Future Considerations
As bandwidths, frequencies, sampling rates, and other performance metrics continue to increase, managing the results of our tests and measurements will only compound in processing and storage requirements. Cloud computing provides a compelling way to leapfrog into a simple, high-performance tool with minimal footprint in your test engineering environment. The future always tends to arrive more quickly than we expect. Shouldn’t our tools evolve as fast, too?

About the Author
Nick Edwards
CEO
Nick Edwards is founder and CEO of GradientOne Inc. He graduated with a BS in Control Systems Engineering from the US Naval Academy, and subsequently spent five years as a Submarine Officer on Los Angeles Class fast attack submarines. After the Navy, he attended Harvard Business School, where he obtained an MBA, and has since spent his entire career working for startups and big companies in Silicon Valley, including Silver Tail Systems/RSA, the security division of EMC, Cisco Systems via the IronPort Systems acquisition, and Redback Networks.
Comment About the Article
To join the conversation, and become an exclusive member of Electronic Design, create an account today!

Leaders relevant to this article: