When testing semiconductors, specialized test instrumentation is used to determine device parameters. When the semiconductors are high-power semiconductors like diodes, switches, FETs, and insulated gate bipolar transistors (IGBTs), the parametric analyzers used to test these devices will need to drive the devices to high current or high voltages.
However, these parametric tests are performed on a pulsed basis to avoid self-heating within the power devices. Although the power developed by the parametric analyzer can be high, it is only for a short time. So what can you do if you want to measure the heating effects of a power device? Since the parametric analyzer cannot provide continuous high power to cause self-heating, a different approach is needed.
This file type includes high resolution graphics and schematics when applicable.
On The Bench
Let’s use the example of trying to measure the change in on-resistance Ron of a transistor. You need to apply power for several seconds to observe the change in Ron, which can uncover information about the material and bonding within the device.
You could turn to a high-power power supply to apply a constant voltage across the device, which will drive current through the device and cause the self-heating. You must simultaneously measure the profile of the current as it changes due to the change in the device’s resistance. Divide the measured current profile into the constant voltage setting, and you can see the changing resistance profile as the device heats up.
Or, you could use the built-in measurements in an average high-power power supply, but you are likely to find the current measurement accuracy of the supply is not good enough to see the small changes in the high current as the resistance changes. Furthermore, the voltage set point accuracy may not be good enough either, so you will need to simultaneously measure the voltage and the current to get the best possible calculated resistance profile.
Typically, a digital multi-meter (DMM) is used to measure voltage accurately. Since you are trying to measure voltage and current together to get a profile, you may instead turn to a digitizer to capture the voltage while simultaneously capturing current. High-speed precision digitizers can accurately measure this voltage. You might be tempted to use a scope, but most scopes do not offer the measurement accuracy you need.
Measuring the current becomes the real challenge. Since this is a power device, you may need to measure high currents. Most DMMs can only measure a few amperes of current. Also, since you need to capture current as it changes, you will need to rapidly make DMM measurements. The reading rate of a DMM, especially when you want to measure with maximum accuracy, can be quite slow.
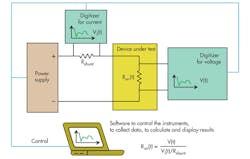
Instead of using a DMM, you may turn to the same high-speed, high-accuracy digitizer that you are using to measure voltage, but it can’t measure current. Now you’ll need a high-precision shunt, with a very stable known resistance, and then calculate the current flowing by measuring its voltage drop. Simultaneously, you’ll need to measure the voltage across the semiconductor. Then, you’ll need to write software to set up and capture the two waveforms, calculate the resultant Ron profile, and present the data to get a picture of the measurement being made.
This method will work, but it is quite a complex setup requiring multiple digitizers, precision shunts, and software (Fig. 1). You’ll also have to determine the accuracy of the resultant measurement, as the specifications of the digitizer are not the final system specifications. You need to account for the precision shunt.
A Better Option
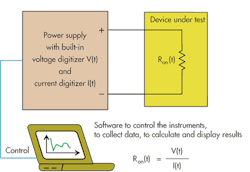
A more ideal solution would be to use a high-accuracy, high-power power supply (Fig. 2). It should have dual digitizers to simultaneously measure the voltage profile across the device and the current profile of the current flowing through the device. If the power supply had software to collect and show this data, you would quickly get the answer you need.
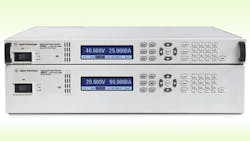
The N7900 Series Advanced Power System (APS) high-performance power supplies from Agilent Technologies can provide up to 160 V, 200 A, and 2000 W (Fig. 3). They feature 18-bit resolution and 0.1% accuracy on measurements. Voltage and current can be simultaneously captured at 200 ksamples per second into 512-ksample buffers, allowing you to get precise profiles of the voltage and current.
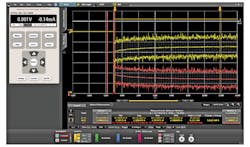
Agilent’s 14585A Control and Analysis Software supplements the APS. It can capture the waveforms, compute the Ron profile, and then graphically present all the data so you can see the changing Ron without having to write a program (Fig. 4).
Bob Zollo is a product planner with the Power and Energy Division, Electronic Measurements Group, at Agilent Technologies. He is responsible for creating Agilent’s power products roadmap by researching customer and industry trends and developing product plans to meet emerging customer needs. He holds a degree in electrical engineering from Stevens Institute of Technology in Hoboken, N.J. He can be reached at [email protected].
About the Author
Bob Zollo
Solution Architect for Battery Testing, Electronic Industrial Solutions Group
Bob Zollo is solution architect for battery testing for energy and automotive solutions in the Electronic Industrial Solutions Group of Keysight Technologies. Bob has been with Keysight since 1984 and holds a degree in electrical engineering from Stevens Institute of Technology, Hoboken, N.J. He can be contacted at [email protected].


