Understanding Error Vector Magnitude

Download this article in .PDF format
Error vector magnitude (EVM) is a measure of modulation quality and error performance in complex wireless systems. It provides a method to evaluate the performance of software-defined radios (SDRs), both transmitters and receivers. It also is widely used as an alternative to bit error rate (BER) measurements to determine impairments that affect signal reliability. (BER is the percentage of bit errors that occur for a given number of bits transmitted.) EVM provides an improved picture of the modulation quality as well.
EVM measurements are normally used with multi-symbol modulation methods like multi-level phase-shift keying (M-PSK), quadrature phase-shift keying (QPSK), and multi-level quadrature amplitude modulation (M-QAM). These methods are widely used in wireless local-area networks (WLANs), broadband wireless, and 4G cellular radio systems like Long-Term Evolution (LTE) where M-QAM is combined with orthogonal frequency division multiplexing (OFDM) modulation.
Table Of Contents
• Digital Modulation Overview
• EVM Definition
• EVM Measurements
• Signal Impairments
• References
Digital Modulation Overview
Digital modulation methods convert bit voltage level transitions and patterns into sine wave carrier variations. The most basic forms of digital modulation are amplitude shift keying (ASK), frequency shift keying (FSK), and phase shift keying (PSK). ASK represents bit variations as different carrier amplitude levels. FSK represents bit variations as two different carrier frequencies. PSK translates the bit variations into two different carrier phases, usually 180° apart.
These basic methods are widely used in simple wireless systems. However, most modern wireless systems use multi-level modulation schemes to transmit higher data speeds into limited bandwidth channels. These methods use more two or more different carrier conditions called symbols to represent multiple bits that deliver more bits/Hz of bandwidth. The most common examples are M-PSK and M-QAM.
M-QAM uses a combination of both amplitude and phase to represent multiple-bit words. One popular modulation scheme, QPSK, transmits two bits per symbol. This is also known as 4-QAM. With 2 bits, four symbols are can be generated. Each 2-bit code modulates a sine or cosine carrier in a balanced modulator or mixer to produce an in-phase (I) or quadrature (Q) signal (Fig. 1).
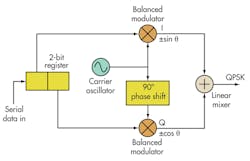
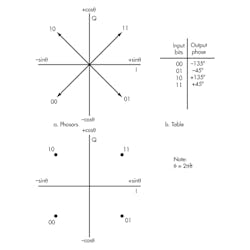
These analog I and Q signals (+sinθ, –sinθ, +cosθ, and –cosθ) are combined in a linear mixer to produce the final output. Mixing these I and Q signals produces four possible outputs, represented as phasors (Fig. 2). The constellation diagram sums up all the necessary characteristics of a QPSK signal and is the primary graphic used in presenting and analyzing M-QAM signals.
This technique can also be used to produce even higher levels of modulation like 16-QAM where each 4-bit code group generates one of 16 different symbols (Fig. 3).
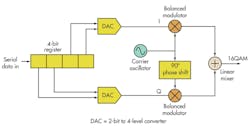
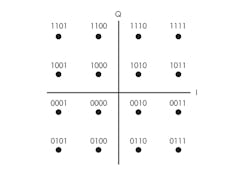
A specific carrier amplitude and phase represents each 4-bit word (Fig. 4). This technique is readily extended to even higher levels such as 64-QAM, 256-QAM, and 2048-QAM. All of these methods increase the data rate in a given channel bandwidth with higher spectral efficiency.
8-PSK uses eight different phase shifts 45° apart to represent 3-bit code groups from 000 to 111 (Fig. 5). Each specific phase corresponds to an assigned 3-bit code group. A 16-PSK system is similar but uses 16 phases 22.5° apart, each phase representing a 4-bit code group. These methods provide spectral efficiency in that more bits of data can be transmitted in a limited bandwidth.
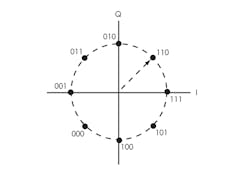
The main problem with such multi-phase, multi-level systems is that circuit imbalances, unintended phase shifts, amplitude differences, and noise distort the signal and therefore introduce errors. A phase shift and/or amplitude error means that the signal is interpreted incorrectly leading to bit errors and an increase in the BER. The greater the number of phase shifts or phase-amplitude symbols used, the more likely there will be errors due to signal impairments. For instance, 8-PSK is less susceptible to errors and thus more reliable than 16-PSK. QPSK is less susceptible to errors than 64-QAM under the same conditions.
EVM Definition
EVM is a figure of merit for modulation accuracy. It provides a way to measure and evaluate multi-level, multi-phase modulation methods like M-QAM and M-PSK. EVM considers all of the potential phase and amplitude distortions as well as noise and provides a single comprehensive measurement figure for determining the quality of a circuit or product.
Using phasors in the I/Q plane, EVM illustrates the reference or ideal symbol vector location and size compared to the actual measured vector (Fig. 6). The difference between the two is the EVM, which can be measured on transmitter modulator or receiver demodulator circuits.
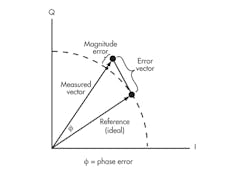
EVM is the ratio of the average of the error vector power (Perror) to the average ideal reference vector power (Pref) expressed in decibels. The averages are taken over multiple symbol periods:
EVM (dB) = 10 log (Perror/Pref)
You will also see it expressed as a percentage:
EVM (%) = √(Perror/Pref) x 100
EVM Measurements
A vector signal analyzer (VSA) makes the measurements (Fig. 7). A vector signal generator (VSG) is used to generate a test signal if needed. The VSA samples the signal multiple times and stores the measurements. EVM calculation software then provides the actual measurement results.
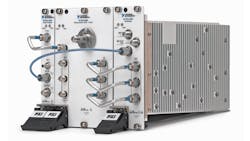
The signal to be measured is carefully demodulated and compared to the ideal or reference signal that is produced mathematically from the received signal. The difference between the reference signal and the demodulated signal is the error. The VSA will display a constellation diagram of the modulation and multiple phasor points for each measurement. A single point is ideal, but in practice there will be a cluster of actual points around the ideal point. The more widespread the points, the poorer the EVM.
It is important to point out that the higher decibel values represent the best error-free modulation results. For example, an EVM of –40 dB is better than one of –25 dB. In terms of percentage, –40 dB converts to 1% error while 25 dB translates to 5.6% error.
Signal Impairments
A wide range of potential problems can cause poor modulation quality and the resulting bit errors. Some of these include IQ mismatch in the modulator or demodulator circuits resulting from gain and phase differences and dc offset. Frequency offset and phase noise also result in misplaced points in the constellation. AM-AM and AM-PM distortion, noise and multipath fading, and signal interference are other factors. EVM measurement does not locate the cause of the poor EVM measurement, so some troubleshooting and analysis are required.
References
1. Digital Modulation in Communications Systems – An Introduction, Application Note AN1298, Aglient Technologies
2. Scott, A.W., Frobenius, Rex, RF Measurements for Cellular Phones and Wireless Data Systems, Wiley/IEEE, 2008
3. Shafik, R.A., et al., On the Error Vector Magnitude as a Performance Metric and Comparative Analysis, IEEE 2nd International Conference on Emerging Technologies, November 2006
About the Author

Lou Frenzel
Technical Contributing Editor
Lou Frenzel is a Contributing Technology Editor for Electronic Design Magazine where he writes articles and the blog Communique and other online material on the wireless, networking, and communications sectors. Lou interviews executives and engineers, attends conferences, and researches multiple areas. Lou has been writing in some capacity for ED since 2000.
Lou has 25+ years experience in the electronics industry as an engineer and manager. He has held VP level positions with Heathkit, McGraw Hill, and has 9 years of college teaching experience. Lou holds a bachelor’s degree from the University of Houston and a master’s degree from the University of Maryland. He is author of 28 books on computer and electronic subjects and lives in Bulverde, TX with his wife Joan. His website is www.loufrenzel.com.
Comment About the Article
To join the conversation, and become an exclusive member of Electronic Design, create an account today!

Leaders relevant to this article: