When characterizing jitter performance, it is common to measure jitter output of a transmitter and jitter tolerance of a receiver. When measuring jitter tolerance, various quantities of intersymbol interference (ISI), periodic jitter (PJ), and random jitter (RJ) must be added to ensure the receiver can tolerate data signals with significant jitter and still have a low bit error rate (BER).
PJ components can be measured on a variety of instruments: a spectrum analyzer, a digitizing oscilloscope (DSO), and a time interval analyzer (TIA). The theoretically expected values over a wide PJ frequency and amplitude range are computed and then compared to measurements obtained from each type of instrument.
Jitter Overview
Jitter is a period/frequency displacement of a signal from its ideal location. These displacements can occur in amplitude, phase, or pulse width and generally are categorized as either deterministic or random in nature. Deterministic jitter is composed of duty-cycle distortion (DCD) and ISI, bounded uncorrelated, and PJ components. PJ is caused by one or more sine waves and their harmonics.1
Measurement Techniques
There are many techniques and equations for obtaining the PJ amplitudes from different instruments. The TIA, a Wavecrest SIA-3000, and the DSO used for this experiment have software that extracts the PJ amplitudes automatically.
Measurement Setup
For this experiment, a 1.5-GHz square-wave signal generator is used as the clock source for a 12-GHz pattern generator. This generator has an internal maximum modulation of 1 MHz, so a second sine-wave signal generator (9 kHz to 4 GHz) is fed into the FM input on the square-wave signal generator and used as an external modulation for frequencies above 1 MHz.
The square-wave signal generator also has an external FM input with a 10-MHz bandwidth. Frequencies at or near 10 MHz won’t correlate to the equations described in the spectrum analyzer section of this article because they are attenuated approximately 3 dB. The data output of the pattern generator is fed into the various measurement instruments.
Effect of PJ on a Signal
To properly measure PJ, you must understand how PJ affects signals. Figure 1 shows the effect of a PJ component on a clock signal. The first signal is an ideal clock or what the clock would look like without modulation. The second signal is the resulting clock generated by modulating the ideal clock with the PJ profile shown in the third signal.
During the PJ sine-wave positive time, the modulation lengthens the resulting modulated clock periods. The cumulative effect of several longer-than-ideal periods is greatest at one-half of the modulation cycle.
After this point, the negative side of the phase-modulated sine wave will begin shortening the resulting clock periods, and you will be moving back toward ideal. Notice that after one cycle of the modulation, the positive deviations equal the negative deviations, and you now are back to your ideal clock bit position. This is what happens when your measurement technique synchronizes you to a PJ source. You never see its effect.
Spectrum Analyzer Measurements
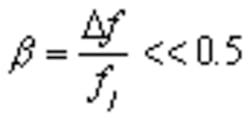
Spectrum analyzers can be used to measure PJ only on clock signals. Also, the PJ amplitude must meet the following requirement:2
where: b = ratio of peak deviation to modulation frequency
Df = peak deviation of the modulation, sometimes called FM
fj = frequency or rate of the modulation
This is the case where the modulation is narrow-band FM (NBFM). If b is greater than 0.5, a complicated solution using Bessel functions of the first kind is required.2
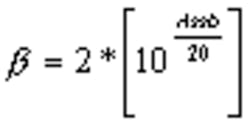
The following equation is used to determine b for a NBFM sideband.
where: Assb = amplitude of the upper sideband relative to the carrier in dB
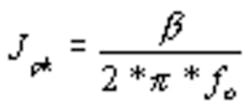
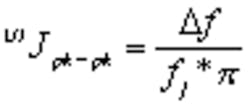
Then, the peak cumulative jitter (Jpk) in seconds (s) is given by the following equation:3
where: fo = 1.5 GHz
The peak-to-peak jitter (Jpk-pk) is given by this equation:
Jpk-pk=Jpk * 2
where: Jpk-pk = expected amplitude of a single sine-wave modulation in seconds
TIA Measurements
The TIA can directly measure PJ amplitude and frequency on both clock and data signals. For a clock signal, the TIA uses either the low-frequency modulation (LFM) tool or the high-frequency modulation (HFM) tool. Figure 2 shows an example plot.
To measure a data signal, a pattern sync is needed to use the known pattern with marker (KPWM) tool. An internally generated marker can be used if a pattern sync isn’t available.
To measure PJ, a histogram of one period measurement is made. The 1-sigma (standard deviation) of this histogram then is plotted vs. the number of periods being measured. Then the process repeats for several periods.
A patented autocorrelation routine is run on the resulting variance of the 1-sigma plot, and then an FFT is performed to convert to the frequency domain. The resulting FFT shows all of the PJ amplitudes and frequencies present on the signal being measured. All of these measurements are done randomly, eliminating any possible synchronization to the PJ frequency, with a hardware resolution of 200 fs (1 fs = 10-15 s).4
Theoretical Expected Value for Experimental Setup
The following equation can be used to convert the Df or FM amplitude into unit intervals (UI) of jitter:2
Since 1 UI = 1/BitRate, the jitter in seconds is given by the following equation:3
This value then can be used for correlation to the PJ peak-to-peak values acquired by the other measurement techniques.
Measurement Results
Table 1 shows the results of the correlation to the expected mathematically derived values from the sine-wave generator’s settings. A 1010 data pattern was used for all measurements except for the TIA KPWM data mode. For this case, a PRBS 27-1 data pattern was used.
Table 1. Actual PJ Measurements vs. Mathematically Derived Values for Various Instruments
(Wavecrest SIA-3000)
Analyzer
Since the data is 1010 for the other setup, the TIA CLK HFM tool also is used. These results are for the range of PJ frequencies from 30 kHz to 10 MHz (3-dB point of the square-wave generator). The amplitudes used were the highest amplitude that the DSO could measure. Also, several low-amplitude PJ modulations are included.
The results show very good correlation between all measurements. For the last two 10-MHz cases, the TIA and spectrum analyzer measured a lower value than calculated. This is due to the 3-dB attenuation of the FM input to the square-wave signal generator. Figure 3 shows a plot of these correlation error values.
Instrument Measurement Limitations
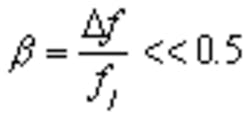
Each instrument has specific PJ amplitude and frequency ranges capable of providing accurate measurements. For spectrum analyzers, the NBFM model is valid only when b << 0.5. This equates to PJs with amplitudes less than about 0.5 UI.
The minimum detectable PJ amplitude needs to be above the instrument’s noise floor, which equals about 100 fs for the spectrum analyzer used in this experiment. Also, the spectrum analyzer is unable to measure PJ below its low-end bandwidth, which equals 7 kHz for this instrument. The DSO measures a wide range of PJ frequencies down to about 1 ps in amplitude on clock or data streams and will show an FFT for determining PJ frequency but cannot accurately measure PJ on the data signal.
The TIA measures amplitudes down to less than 10 attoseconds (1 attosecond is 10-18 s) of single-cycle PJ for lower-frequency jitter components and less than 75 fs of cumulative PJ amplitude.5 The theoretical adjacent cycle maximum deviation is the only limit to the maximum PJ amplitude that the TIA can measure.
The TIA clock measurements also were the most accurate with 0.8% average error over all measurements. This can be attributed to the short-term stability of the TIA time base, which is 0.05 ppb (0.00005 ppm) over 1 ms.
Most DSOs have a time-base stability of approximately 1,000 ppb (1 ppm). This gives the TIA a 20,000× improvement in time-base accuracy over DSOs. Also, software is available that contains all of the patented algorithms necessary to extract the PJ frequency and amplitude information on either clock or data streams over a wide range of PJ frequencies and amplitudes.
Conclusion
A variety of techniques for measuring PJ and comparing the results with expected values shows that the measurement data correlates to the expected values, which validates the various techniques. Each instrument has a range of frequencies and amplitudes over which it measures correctly, and the guidelines described in this article can help you choose which instrument to use for your particular setup.
References
- National Committee for Information Technology Standardization, Fibre Channel Methodologies for Jitter Specification-2, Rev. 0.0, April 11, 2000.
- Schwartz, M., Information Transmission, Modulation, and Noise, Fourth Edition, 1990.
- Wavecrest Proprietary Private Internal Communication.
- Wavecrest, SIA-3000 Specification, 2002
- Emmerich, C., Measuring Low-Frequency Attosecond Jitter With the Wavecrest SIA-30000, May 2002.
About the Author
Craig Emmerich is the product marketing engineer at Wavecrest. He has conducted seminars around the world on the topic of signal integrity and currently is a voting member of the SATAII PHY Group and the SATAII Jitter Subgroup, the Intel Developer Network Groups for PCI Express, and the PCI-SIG PCI Express Enabling Group. Mr. Emmerich received a B.S.E.E. from the University of Minnesota. Wavecrest, 7626 Golden Triangle Dr., Eden Prairie, MN 55344, 952-831-0030, e-mail: [email protected]
FOR MORE INFORMATION
on jitter analysis
www.rsleads.com/309ee-178
Return to EE Home Page
Published by EE-Evaluation Engineering
All contents © 2003 Nelson Publishing Inc.
No reprint, distribution, or reuse in any medium is permitted
without the express written consent of the publisher.
September 2003
