Use An LED Dot-Graph Display To Complement Your DVM Readout

This file type includes high resolution graphics and schematics.
LEDs often are used to form a dot/bar graph display.1-4 You also can use an LED dot-graph display as a complement to a digital voltmeter (DVM) with the LM3914 dot/bar display driver and nine LEDs.5 This is useful where the input voltage is unstable, so the voltmeter indications are variable and the result is hard to read and understand.
By adding an associated circuit, the DVM measures and displays the approximate mean value of the input voltage, while the LED dot-graph provides information about the voltage’s stability. This approach is suitable for rapidly testing power supplies.
The input signal passes through low-pass filter R1C1 to a digital voltmeter (Fig. 1). The filter’s output is the mean value of the input signal, so the voltmeter indicates it is stable, and it is easy to read. (If the digital voltmeter has a built-in averaging option, the low-pass filter is not required.) Capacitor C2 passes the variable component of the input voltage to U1, and the LED dot graph that U1 drives indicates the intensity of these variations.
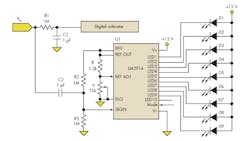
1. The LED dot-graph display uses a standard display driver preceded by a high-pass filter. It visually complements a digital voltmeter’s numeric output.
Figure 2 (obtained by simulation) shows how the low-pass and high-pass filters pass the mean and variable components of the input signal, respectively. If the input voltage is stable and doesn’t have any ripple, only central LED D5 lights up.
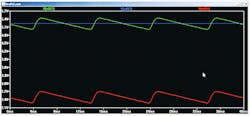
2. The simulation of the waveforms of VIn (V[n001]) as well as the voltage at the low-pass filter output (junction of R1/C1), (V[n002]) and at the high-pass filter output (junction of R2/R3/C2) (V[n003]) show how the low-pass and high-pass filters pass the mean and variable components of the input signal, respectively.
As voltage ripples increase, the adjacent diodes begin to flicker. For larger ripples, more of the adjacent diodes light. Potentiometer P controls the LED dot-graph’s sensitivity, with maximum sensitivity of 0.125 V when P is set to 0 Ω. Nine of the 10 available LED outputs are used.
References
1. “LED bar-graph display represents two digits,” Ajoy Raman, Bangalore, India, EDN, September 22, 2011.
2. “PIC microprocessor drives 20-LED dot- or bar-graph display,” Noureddine Benabadji, University of Sciences and Technology, Oran, Algeria, EDN, September 1, 2006.
3. “Drive 16 LEDs with one I/O line,” Zoran Mijanovic and Nedjeljko Lekic, University of Montenegro, Podgorica, Montenegro, EDN, June 9, 2011.
4. “Drive 12 LEDs with one I/O line,” Charaf Laissoub, Maisons Alfort, France, EDN, February 4, 2010.
5. “LM3914 Dot/Bar Display Driver,” National Semiconductor, February 2003, http://bit.ly/naDCRG.
Nedjeljko Lekic works at the University of Montenegro, Department of Electrical Engineering. He holds a PhD in electrical and computer engineering from the University of Montenegro. He has been working on designing identification systems based on RFID and/or biometrical identifiers as well as microcontroller systems for industrial automation.
Zoran Mijanovic has been working as a professor with the electro-technical faculty at the University of Montenegro. He is engaged in industry mostly to find and design solutions for novel needs. He has designed many microcontroller devices for automation and control. He has a PhD in electronics from the University of Belgrade.
This file type includes high resolution graphics and schematics.
About the Author
Nedjeljko Lekic
Nedjeljko Lekic works at the University of Montenegro, Department of Electrical Engineering. He holds a PhD in electrical and computer engineering from the University of Montenegro. He has been working on designing identification systems based on RFID or biometrical identifiers as well as microcontroller systems for industrial automation.
Zoran Mijanovic
Professor
Zoran Mijanovic has been working as a professor with the electro-technical faculty at the University of Montenegro. He is engaged in industry mostly to find and design solutions for novel needs. He has designed many microcontroller devices for automation and control. He has a PhD in electronics from the University of Belgrade.
Comment About the Article
To join the conversation, and become an exclusive member of Electronic Design, create an account today!

Leaders relevant to this article: