How to Design a Good Vibration Sensor Enclosure (Part 3)
This article is part of the Analog series: How to Design a Good Vibration Sensor Enclosure
Members can download this article in PDF format.
What you'll learn:
- Performing modal simulation using a FEM mesh.
- The design and analysis of an IP67-rated rectangular enclosure.
- Adding epoxy resin to a vibration sensor enclosure.
- Mounting techniques for a vibration sensor.
Based on the simulation and analytical results presented in Parts 1 and 2, a cylindrical enclosure will perform best for housing a single-axis ADXL1002 MEMS sensor with 21-kHz resonance. The MEMS sensor axis of sensitivity should be oriented to take advantage of the cylindrical enclosure’s first natural frequency performance in the z-axis.
Enclosure Prototype and Assembly Concept
The simulation models presented so far have excluded connector choices and their influence on the natural frequencies of the enclosure design. Figure 1 shows an M12 4-wire connector, part number T4171010004-001 from TE Connectivity. This connector is IP67-rated for water and dust resistance and includes a .STEP file from TE that can easily be integrated into the enclosure design file. The connector can be used with an M12-to-M12 cable, such as the TAA545B1411-002 from TE.
A good mechanical mounting is critical to ensure the best transfer of vibration and avoid resonances that may affect performance. A good mounting is typically achieved using a stud threaded to both sensor enclosure and monitored equipment. The stainless-steel model shown in Figure 1 includes a solid 7-mm base with a standard 1/4-in.-28-in. threaded hole for mounting the stud attachment to the monitored equipment.
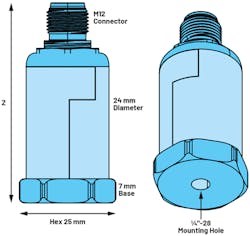
The enclosure measures 24 mm in diameter and includes a hexagonal 25-mm base, which can be used to torque the sensor into the monitored equipment. The total height of the enclosure with M12 connector can be varied between 48 and 57 mm, depending on manufacturing tolerances and assembly of internal wiring or soldering options from the connector to the MEMS PCB. For example, at least 5 mm of height is needed if using a straight wire connection between the M12 cap and the MEMS PCB.
Figure 2 shows an exploded view of one possible assembly option for the enclosure, M12 connector, and MEMS PCB. The MEMS PCB can be assembled to the enclosure wall using M3 screws, then attached to the M12 connector, and finally the two enclosure pieces can be laser welded together.
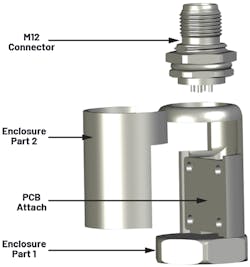
The PCB is vertically mounted as shown, with the ADXL1002 MEMS axis of sensitivity aligned vertically with the z-axis of the enclosure. A vertical mount also is important from a system measurement perspective, as this orientation is usually required to measure bearing faults (e.g., radial vibration measurements) on motors.
Modal Simulation
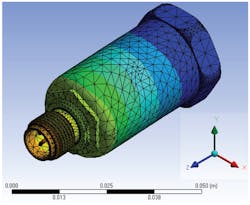
Before modal simulation, one solid body should be created using the components shown in Figure 2. This will provide a simulation model that closely matches an assembled and welded sensor. A fine mesh should be selected for accurate finite-element-method (FEM) numerical simulation, especially for the connector geometry. The Fine Span Angle Center ANSYS Mesh option should be selected for best performance. Figure 3 shows the FEM mesh and relative deformation of the enclosure after simulation.
The gradual gradient from blue to orange and red in Figure 3 illustrates the larger relative structural deformation at the top of the enclosure and the connector.
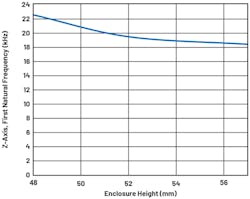
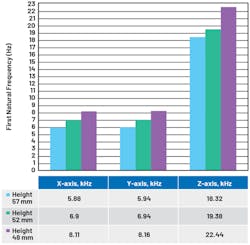
Figures 4 and 5 show the FEM results for first natural frequency with significant mode participation factor, or MPF, (greater than 0.1 for the ratio of effective mass to total mass of the system) vs. total sensor height for the z-axis. The z-axis performance is critical, with 19.38 kHz for first significant natural frequency when the enclosure height is at 52 mm. For 48-mm total height, the performance improves to 22.44 kHz. A 50-mm-height enclosure will give around 21-kHz performance.
Triaxial 10-kHz MEMS Sensor with 21-kHz Resonance
Controlling the natural frequency of an enclosure design across three axes is a more difficult task compared to a single-axis sensor, particularly when 21-kHz performance is required.
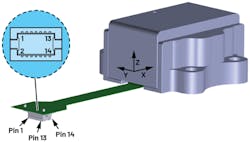
Addressing that issue, Analog Devices developed the ADcmXL3021 ±50-g, 10-kHz, triaxial, digital output MEMS vibration-sensing module (Fig. 6). It’s housed in a 23.7- × 27.0- × 12.4-mm aluminum package with four mounting flanges to support installation with standard M2.5 machine screws. The package’s aluminum material and geometry support resonant frequencies of greater than 21 kHz across x, y, and z axes.
Adding the ADcmXL3021 to an IP67-Rated Enclosure
An IP67-rated (water- and dust-proof) enclosure and connector are required for placing the ADcmXL3021 in industrial environments. In addition, the SPI output from the ADcmXL3021 isn’t suitable for use with long cables. The SPI output must be converted for long cable driving, using industrial Ethernet or RS-485 transceiver circuits.
Based on the studies in this series, it’s not possible to place the ADcmXL3021, the RS-485 or Ethernet PCB, and a connector in the same enclosure and achieve 21-kHz resonant frequencies across all three (x, y, and z) axes. The combination of components will result in a minimum enclosure size like that shown previously in Part 1’s Figure 2 (40 × 43 × 37 mm). It provided a first significant natural frequency of around 10 to 11 kHz across three axes. In addition, it wasn’t simulated using a connector, which will increase the effective height and reduce the natural frequencies further.
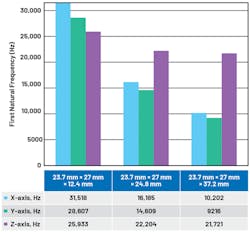
If a simple rectangular aluminum shape is simulated using FEM, with 23.7- × 27- × 12.4-mm dimensions (like the ADCmXL3021) and 2-mm wall thickness, the first significant natural frequency exceeds 21 kHz across all axes.
When the 12.4-mm height is doubled and tripled to provide space for additional circuitry, the natural frequency reduces significantly (Fig. 7). Even with just a 12.4-mm allowance for additional circuitry, the first significant natural frequency falls below 15 kHz.
A Distributed System
Instead of trying to fit all components into one rectangular enclosure, a distributed system like that in Figure 8 is suggested. Using this concept, the ADcmXL3021 is housed in an IP67-rated enclosure, with SPI data routed over a short distance (less than 10 cm) to a separate IP67 enclosure. This houses the cable interface PCBs with an Ethernet or RS-485 transceiver, as well as an associated power-supply IC and other circuitry.
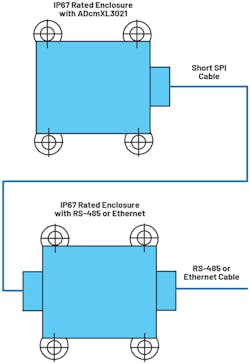
Using this approach, the geometry is significantly reduced, and the problem of matching the enclosure’s natural frequency to that of the ADcmXL3021 is significantly easier.
Design and Modal Analysis
As shown previously, a rectangular shape is a good approach to achieve similar natural frequency performance across three axes versus a cylindrical shape. In Figure 8, the ADcmXL3021 is placed in a small, hollow, rectangular enclosure with a tiny PCB to interface between the ADcmXL3021 flex cable and industrial connector. A small profile M8 connector, such as the TE 7-1437719-5, can be used with the model.
The rectangular enclosure includes four M2.5 mounting holes to provide a fixed mounting to equipment. The total enclosure size is 40.8 × 33.1 × 18.5 mm. Critically, the z-axis height is 18.5 mm, which helps to achieve higher-frequency modes.
As shown in Figure 9, the y, x face and four M2.5 holes are constrained for modal simulation. The z direction is the weakest link in the design, even at sub-20 mm heights.
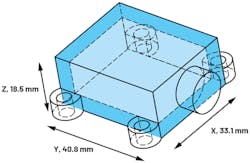
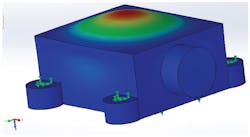
Figure 10 illustrates one of the FEM modal simulation dominant modes, which reveals the larger relative structural deformation at the top of the enclosure.
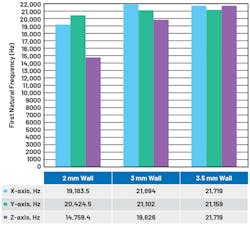
The z direction stiffness can be increased by increasing the wall thickness. For example, if 2-mm wall thickness is used, the z direction’s first significant natural frequency is at 14.76 kHz. When a 3-mm wall thickness is used, this increases to 19.83 kHz. Figure 11 shows that using a 3.5-mm wall thickness provides greater than 21-kHz natural frequency in the z direction.
Adding Epoxy in the Enclosure
Epoxy resin can be added to vibration sensor enclosures to hold hardware PCBs in a fixed position as well as prevent movement of connectors and internal wiring.
To study the effects of epoxy resin on the natural frequency of an enclosure, a simple FEM model was created with a 40- × 40-mm hollow, stainless-steel cube of fixed 2-mm wall thickness. The cube was filled with 36- × 36-mm epoxy resin. The height of the enclosure was increased from 40 to 80 mm to 100 mm, and alternate simulations were performed with and without the epoxy fill. The FEM simulations were performed with the x, y surface as the fixed constraint.
Table 1 presents the simulation results, with some interesting findings:
- For smaller sensor heights, and where the height is equal to the length/width, the epoxy resin boosts the first significant natural frequency in the cantilevered axis (z) by up to 75%.
- Where the sensor height of 80 mm is 2× the length/width, the first significant natural frequency in the cantilevered axis (z) increases by 16% when using an epoxy resin fill. However, the x and y radial axes reduce by 10%.
- As the height increases to 3× of the length/width, the epoxy resin reduces the first significant natural frequency.
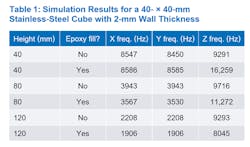
As height increases, the mass increases and the stiffness decreases. At a certain point, the mass increase has a greater influence than the added epoxy stiffness. For the given simulation example, this inflection point is at greater than 80 mm.
However, most sensors are usually less than 80 mm in height. So, it can be concluded that, for most cases, adding epoxy resin will aid the natural frequency performance for a vibration sensor enclosure solution.
External Cable Simulation
After mounting a vibration sensor on a machine surface, the cable should be anchored to reduce stress at cable terminations and to prevent false signals due to cable vibration. When securing the cable, leave enough slack to allow for free movement of the accelerometer.7
This section simulates the effect of a vibrating cable on system response and provides guidance as to where the cable should be clamped (at what cable length).
A simulation model was created, with the material properties as shown in Figure 12. TE provides connector and cable models, such as the TAA545B1411-002, which can be used as a baseline. The cable connector is made from Nylon (Nylon 6/6), with copper cable wire and PVC insulation. The attached sensor is designed using stainless steel and filled with epoxy resin.
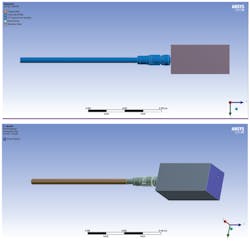
The simulation model is supported with a fixed constraint on the sensor attach, and the 0.15-m cable is free to vibrate along its length. The 0.15-m cable length can be increased to 1 m for simulation.
Table 2 provides the simulation results, with some key findings:
- If the cable is clamped at less than 0.15-m length, then the cable effect on the vibration sensor frequency response is minimal. Both with and without a 0.15-m cable, the frequency response of the sensor enclosure is above 11 kHz.
- If 1 m of cable is attached to the sensor and allowed to move freely and vibrate along its entire length, then the added cable mass will dominate the system frequency response. The cable frequency response of 500 Hz will become the dominant mode.
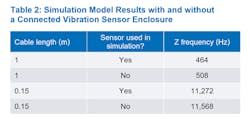
In reality, it’s unlikely that an entire 1-m cable will vibrate, as the vibration will be dampened with increased cable length. However, this simulation example shows that anchoring at around 0.15 m is a good idea for accurate system response.
Vibration Sensor Mounting
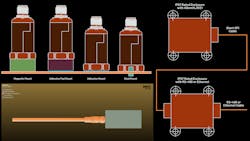
Figure 13 shows the effect on mounting resonance and typical usable frequency range for the stud, adhesive, adhesive mounting pad, and flat magnet techniques shown in Figure 14. Stud and adhesive mounting places the sensor as close as possible to the machine, with best coupling of vibration signal from machine to MEMS sensor.
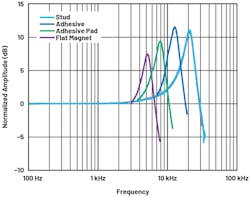
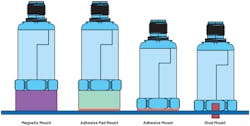
Using a fixture with an adhesive-mounting pad places additional metal material between the machine and sensor. This additional material dampens the frequency response of the sensor solution. The flat magnet mount also dampens the frequency response and doesn’t provide as good a fixed attachment to the equipment as the other methods.
Figure 13 provides typical guidelines only, and each sensor should be characterized via lab measurement or simulation.
Simulation of stud mounting with ANSYS modal analysis is performed using the default bonded contact constraint. This is where the bottom of the vibration sensor—and, in particular, the 1/4-in.-28-in. mounting hole—is designated as a fixed constraint using ANSYS. The constraint type is default bonded or a bolted connection.
Simulation of adhesive contact is an advanced topic and requires ANSYS cohesive zone modeling (CZM) and an understanding of contact mechanics. For accuracy, the ANSYS CZM requires parameters input based on lab test data.
For example, the article “Direct Measurement of the Cohesive Law of Adhesives Using a Rigid Double Cantilever Beam Technique”8 can be used for inputs to ANSYS. If you don’t find experimental data published for your chosen adhesive, then you will need to do some lab measurements.
In addition, the correct contact formulation needs to be set up in ANSYS, with guidance provided in short courses such as Fundamental Topics in Contact.9 Finally, the CZM and modal techniques then need to be combined within the ANSYS workbench.
ANSYS Maxwell10 can be used to simulate magnetic fields. However, as magnetic forces are non-contact forces (they push or pull objects without “solid” contact), generating an appropriate contact constraint for numerical modal analysis isn’t possible. Modal analysis can be performed with bonded, frictionless, frictional, and no separation contacts. CZM contact also may be possible, as mentioned previously.
Conclusion
A good mechanical enclosure design for a MEMS accelerometer will ensure that high-quality vibration data for CbM is extracted from the monitored asset.
Designing a good mechanical enclosure for MEMS accelerometers requires an understanding of modal analysis. Modal analysis provides the natural frequencies in the axis of interest for a vibration sensor enclosure. In addition, the MPF will enable the designer to decide if a frequency can be ignored in a design.
Both material characteristics and geometry need to be considered when designing a vibration sensor enclosure to meet natural frequency targets. Enclosure height must be minimized to achieve higher natural frequencies. Reducing wall thickness or enclosure diameter both have secondary effects on the enclosure natural frequencies.
Cylindrical shapes with higher cross-sectional areas are better designed for higher rigidity and natural frequencies across all axes, compared to rectangular shapes. Rectangular shapes offer more options in sensor orientation and equipment attachment, compared to cylindrical shapes. Rectangular shapes are useful in maintaining similar natural frequency performance across three axes.
For most cases, adding epoxy resin will aid the natural frequency performance for a vibration-sensor-enclosure solution. Using stud or adhesive mounting provides the best usable frequency range for a vibration sensor, while using magnetic or adhesive pads reduces sensor performance.
Read more articles in the Analog series: How to Design a Good Vibration Sensor Enclosure
References
1. ANSYS Innovation Courses: Modal Analysis. ANSYS, 2021.
2. Stephen Timoshenko. Vibration Problems in Engineering, 4th edition. John Wiley and Sons Inc., New York, 1974.
3. Leszek Majkut. “Free and Forced Vibrations of Timoshenko Beams Described by Single Difference Equation.” Journal of Theoretical and Applied Mechanics, Vol. 47, No. 1, January 2009.
4. Mohammad Hossein Abolbashari, Somayeh Soheili, and Anoshirvan Farshidianfar. “Flexural Vibration of Propeller Shafts Using Distributed Lumped Modeling Technique.” The 16th International Congress on Sound and Vibration, Krakow, 2009.
5. Saida Hamioud and Salah Khalfallah. “Spectral Element Analysis of Free - Vibration of Timoshenko Beam.” International Journal of Engineering, 2018.
6. Olivier A. Bauchau and James I. Craig. Structural Analysis: With Applications to Aerospace Structures, Springer, 2009.
7. TN17: Installation of Vibration Sensors, Wilcoxon Sensing Technologies, 2018.
8. A. Khayer Dastjerdi, E. Tan, and F. Barthelat. “Direct Measurement of the Cohesive Law of Adhesives Using a Rigid Double Cantilever Beam Technique.” Society for Experimental Mechanics, May 2013.
9. ANSYS Innovation Courses: Fundamental Topics in Contact. ANSYS, 2021.
10. Ansys Maxwell: Low Frequency EM Field Simulation. ANSYS, 2021.
About the Author
Richard Anslow
System Applications Engineer, Analog Devices
Richard Anslow is a systems applications engineer with the Connected Motion and Robotics Team within the Automation and Energy business unit at Analog Devices. His areas of expertise are condition-based monitoring and industrial communication design. He received his B.Eng. and M.Eng. degrees from the University of Limerick, Limerick, Ireland.
Comment About the Article
To join the conversation, and become an exclusive member of Electronic Design, create an account today!

Leaders relevant to this article: