Basic analog level triggering was developed by Tektronix founders Howard Vollum and Jack Murdock and helped sell the company’s first scope, the Model 511, in 1947. Adding an analog delay line to delay the signal to the vertical amplifier allowed a scope to display the signal that triggered it—a great advantage when troubleshooting.
Scopes with separate trigger and signal paths exhibit timing jitter from one to the other, contributing to trace blurring at the trigger point. When analog CRTs were used as the displays in digital scopes, it was possible to display all the points of a full 4,096-word acquisition. For a 6-inch diagonal CRT, each horizontal location was offset from the next by about 0.001-inch—far less than the width of the trace, so user objection to trigger jitter was minimized. Teledyne LeCroy’s early 9400A DSOs also minimized apparent trigger jitter by using a 1,000-point x 1,000-point magnetically deflected vector display.
In today’s pixel displays that typically have fewer than 1,000 horizontal locations, interpolation generally is required to reduce jitter while aligning waveforms to a fixed trigger location. The 2004 Weller, Draving, and Urban U.S. patent 06753677 assigned to Agilent Technologies explained one way that this could be accomplished:
“The voltage threshold for the trigger level in use by the trigger circuit can be compared to the region proximate the trigger location in the acquisition record to determine by further local interpolation the precise location in the acquisition record where the triggering event should have occurred. This allows the determination of a correct and jitter-free horizontal position value. Actual display of the desired portion of each new acquisition record then proceeds by supplying to the display rendering system a corrected associated horizontal position value.”1
Scopes with analog triggering can time the threshold crossing relative to the previous or next sample pulse. Typically, none of the raw samples will correspond to the trigger point, but by knowing the time that the trigger occurred, a new set of interpolated samples can be developed in which one is exactly at the threshold crossing.
Of course, it’s not as simple as it sounds. One of the second-order effects that adds timing uncertainty is the relationship between a comparator’s propagation delay and the input overdrive. The delay tends to become shorter if the input is considerably larger than the threshold and becomes longer as the overdrive is reduced.
Digital Triggering
Rather than examining the analog signal, instruments that implement so-called digital triggering generate the trigger from the digitized channel data. Hewlett-Packard’s HP 5180-Series of waveform recorders introduced in the early 1980s featured digital triggering. A 1984 description explained, “The 5182A’s high-performance digital trigger uses high-speed digital comparators to match the digitized waveform data against the encoded trigger values. The digital trigger provides repeatable, reliable, no-drift triggering each time.”2
Another claim for digital triggering is that a scope never will trigger on something that hasn’t been captured in memory—you always will know what triggered the scope. This contrasts with analog triggering in which a signal peak falling between samples can cross the threshold to cause triggering but not be captured.
Dave Rishavy, product manager oscilloscopes Rohde & Schwarz USA, cited digital triggering’s drawbacks as complexity and cost. Digital triggering in an R&S scope required a custom ASIC in addition to new hardware and software designs. Also, this type of system cannot trigger on a large off-screen signal.
With regard to the last point, it is possible in some scopes with analog triggering to set the trigger level higher than the displayable range of a main channel. Assuming the signal remains over-range for longer than a sampling period, it will be incorrectly recorded as a full-scale ADC code. Large signals outside the range of the main channel preamp can cause distortion or saturation, and recovery from saturation may affect several subsequent sample periods.
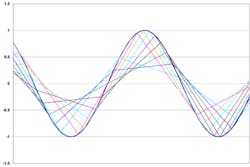
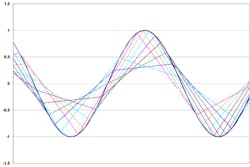
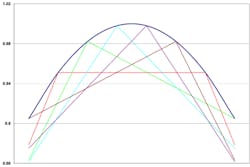
Nevertheless, simply comparing data samples to the trigger threshold doesn’t always recognize a valid trigger unless the sampling rate is much higher than the signal bandwidth or sufficient overdrive exists. As Figures 1a and 1b show, there is a good chance that sampling may not capture the fact that a threshold crossing at the peak has occurred. These figures show a full bandwidth sinewave being sampled with a sampling rate-to-bandwidth ratio of 2.5:1 (Figure 1a, 10 sampling phases) and 5:1 (Figure 1b, five sampling phases). Doubling the ratio reduces the worst-case error in capturing the waveform peak from about 60% to 20%. The threshold is assumed to be equal to the peak—there is no overdrive applied.
At the -3-dB bandwidth frequency, signal amplitude is reduced by 30%, so a full-scale signal at a scope’s band limit would be displayed as a sine 5.6 divs pk-pk. The 60% error then amounts to about 1.7 div relative to a peak or about 54 levels of an 8-bit ADC. The 20% error achieved by doubling the sampling rate reduces this to about 18 lsb.
A sinewave has been used to show the range of sample positions, but the triggering problem actually relates to a transient condition. You may want to trigger on an overshoot, for example, that approximates a single positive half cycle at a scope’s bandwidth. The trigger condition is not repetitive, so if the scope doesn’t happen to sample at exactly the right time, the trigger will be missed.
Simply comparing acquired data to a trigger threshold can’t cause triggering unless a raw sample exceeds the threshold. Both keeping the oversampling ratio as high as possible and positioning the threshold as low as practical will help ensure that valid triggers are not missed.
R&S uses interpolation to find the exact trigger point relative to a preset threshold. Classical sinX/X interpolation or a similar approach is needed to account for the possibility of band-limited peaks between samples. Simple linear interpolation can’t do this.
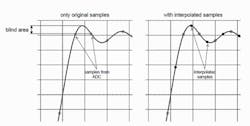
In an R&S application note, this effect is discussed with reference to the graphic reproduced as Figure 2. The blind area is part of a 3.5-GHz waveform and the ADC rate is 10 GS/s—a 2.86:1 ratio. Upsampling with interpolation to 20 GS/s doubles the ratio to 5.72:1 and improves the chance of capturing the threshold crossing by the overshoot. In general, the improvement may not be as much as shown in the figure. The overshoot is small, and the original samples have been positioned so that the interpolated new sample neatly falls at the peak of the overshoot. 3 As shown in Figures 1a and 1b, considerable variation is possible depending on the size of the peak and the position of the samples relative to the peak.
Courtesy of Rohde & Schwarz
Pico Technology also uses digital triggering in its scopes. As stated by the company’s Mark Ashcroft, program manager, “The PicoScope 6000 Series oscilloscopes use two digital comparators for fast and precise detection of the trigger event. Time resolution is equal to the sampling period, in this case 200 ps at all time bases down to 20 ms/div.”
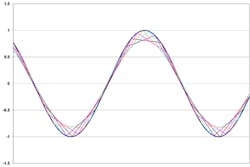
Figure 3 shows the much smaller error resulting from the 10:1 sampling rate-to-bandwidth ratio achieved for the 500-MHz 6000 Series—note the expanded vertical scale. The 4.9% maximum error relative to the peak is equivalent to 0.14 of a division or about 4.5 lsb. Ashcroft explained that “interpolation… and proprietary digital ETS on some other models are used to reduce jitter and enhance timing accuracy.”
The case shown in Figures 1a, 1b, and 3 is an extreme one: Most signals do not contain a maximum amplitude peak at a scope’s full bandwidth, and it’s impractical to set the threshold right on the peak. In general, a 10:1 sampling rate-to-bandwidth ratio and less stringent threshold placement will ensure that no triggers are missed. Nevertheless, the true trigger location still may fall between two samples.
Interpolation
Shannon stated that if the sampling rate is at least 2x the highest signal frequency, exact reconstruction can be accomplished via sinX/X interpolation. If the 2x factor has not been achieved, this type of interpolation should not be used. A LeCroy white paper describes how to determine if sinX/X interpolation is appropriate.
Because the signal is totally asynchronous to the sampling clock, repeated acquisitions of a repetitive signal that are displayed in persistence mode with no interpolation will form a signal-shaped band one sampling interval wide. The signal’s occupation of positions within a sample period will have a normal distribution.
The test consists of comparing a single sinX/X interpolated acquisition to the mean of the previously acquired band of signals. If they are the same, then the necessary conditions for interpolation have been met. If they are not the same, the interpolation routine may create artifacts that are not part of the original signal.4 Input band limiting is an important part of making a scope’s performance as idiot-proof as possible.
Looking at typical scope numbers, a 2.5-GS/s sampling rate with a 1-GHz bandwidth appears to satisfy the 2:1 Shannon/Nyquist criterion. But does it really? Analog scopes feature an approximately Gaussian rolloff beyond the signal bandwidth. The name signifies the optimal Gaussian impulse response for this type of passband shape. It has no overshoot, gives the minimum rise and fall times, and corresponds to the familiar 0.35 product of rise time multiplied by bandwidth. The very gradual attenuation of the frequency response beyond the band edge eliminates Gibbs preshoot and overshoot.
On the other hand, Gaussian-shaped passbands have considerable high-frequency content beyond the bandwidth. Digital filtering can minimize this without producing pulse aberrations. A high-order FIR filter can provide a more rapid transition to the stopband as well as linear phase delay that will not change with time or environmental effects. Many of today’s scopes have a rise time-bandwidth product close to 0.45 and still provide good pulse fidelity. For a given bandwidth, rise times are slower than with the Gaussian shape. Faster passband-to-stopband transitions minimize aliasing in scopes that have low sample rate-to-bandwidth ratios.
References
1. Weller, D. J., et al., Trigger jitter reduction for an internally triggered real time digital oscilloscope, U.S. Patent 06753677, June 22, 2004.
2. “Capture and replay difficult waveforms with confidence using HP's new waveform recorder/generator,” Measurement Computation News, Hewlett-Packard, March/April 1984, pp. 1, 2.
3. Schulze, G., and Freidhof. M., Benefits of the R&S RTO Oscilloscope’s Digital Trigger, Rohde & Schwarz, Application Note, April 2012.
4. Pupalaikis, P. J., Interpolation in Your DSO, LeCroy, White Paper.
