Selecting BMAX For Ferrite Flyback Transformers
Flyback transformers are designed with all types of cores. Ferrite cores have several advantages such as ease of winding on a bobbin with integral terminal pins, better options for winding design (copper foil windings are readily accommodated on a bobbin), easily adjusted core gap, low core loss, multiple mounting options and low cost. One of the drawbacks of ferrite cores is the relatively low saturation flux density compared to other core materials.
Transformer designs must take into account the most extreme environment expected. Worst case operating condition occurs at the highest temperature. The highest operating temperature occurs at the highest operating ambient temperature with the worst case temperature rise of the transformer. Ambient temperature limits are part of the required initial inputs. Temperature rise is a complex calculation. A helpful shortcut is tables of temperature rise per watt of total loss. The total loss (core and copper) are summed and multiplied by the thermal resistance per watt of rise. Reference 1 shows a table of many ferrite core shapes with thermal resistance listed. To illustrate the process, the example below gives a quick calculation as a demonstration.
Temperature rise example: RM-6 core with losses are:
| Core loss- | 320 mW |
| Copper loss- | 120 mW |
| Total loss | 440 mW |
Thermal resistance from Reference 1 = 80 °C/watt
Temp rise = Thermal resistance ×Total loss (Watts)
Temp rise = 80 × 0.44
Temp rise = 35.2 °C
To ensure that a design will not saturate, two steps must be performed. First, establish the maximum temperature that the magnetic will be required to operate. The sum of the maximum operating ambient temperature plus temperature rise must be within the worst case design parameters. The second step is to perform tests to understand how the operating flux density is effected by high temperature.
Saturation flux density is provided by ferrite manufacturers. Suitable power ferrites have published BSAT of 4500 to 5500 gauss. Generally, the manufacturer’s test level of Bsat is beyond useful design levels. Manufacturers also may provide graphs of typical change in Bsat with variation in temperature. To demonstrate a useful design flux level, the “Volt-Second (sometimes Volt-Microseconds)”
est is used. What follows is a condensed description of the test and some of the insight that volt-second testing provides. Tests on three material types with results are shown to give the reader a sense of the effort.
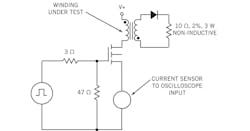
Fig. 1. Flyback transformer test setup.
The volt-second test illustrates measuring inductance in the fundamental way and also illustrates “saturation”. Saturation is one of those terms like “fair”. Everyone understands it but no agreed upon definition of when it occurs seems to exist. Figs. 1 and 2 present a simplified outline of the volt-second test (references 2, 3& 4have greater detail). To simulate a flyback, the volt-second test is performed by applying a square wave pulse and “viewing” the current waveform. Fig. 2 shows an idealized current waveform. The sloping line (rising current) starting at the origin is the direct function of the inductance. Fig. 2 also shows the calculation of the inductance from the input current waveform.
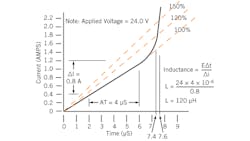
Fig. 2. Idealized current waveform showing the sloping line (rising current) starting at the origin is the direct function of the inductance. This also shows the calculation of inductance from the input current waveform.
In the current waveform, as the core goes into saturation, the trace bends “upward”. As one sees, the core does not saturate “instantly”. Because saturation does not occur instantly, the definition of saturation is a little cloudy. The volt-second test is terminated beyond the point where the current crosses a line with a slope that is 150% of the “inductance” slope. The time from the start of the current pulse (origin) to the 150% intersection is the “time” portion of the volt-second test. The 150% figure is a common imit. The designer may choose any level to limit the worst case current. The “volt” portion is the applied pulse amplitude. In the example the applied pulse is 24 volts and the time to the 150% intersection is 7.6 µs. The volt-seconds is 24 X 7.6 µs or 182.4 volt-µs. It should be noted that the volt-second product of a given core and winding is constant. If the example were to be performed with a 12 volt pulse the “time” would double to 15.2 µs maintaining the 182.4 volt-µs product. The volt-second test is relatively difficult to perform. Below are some helpful notes on performing the test.
•If a current transformer is used as the sensor, the transformer must be rated to handle the DC current. If the sensor is a resistor, use a non-inductive type.
•Fig. 2 is idealized. Turn-on switching noise is not shown. The inductance may be calculated from any straight section of the line, according to the formula shown in Fig. 2.
•A clear template with graticule lines can be used to provide the inductance and the 120% & 150% slope lines. When the oscilloscope trace crosses the graticule, the time is recorded.
•Vertical gain can be adjusted to get traces of the necessary slope. Calibrated vertical gain is not required to obtain the graticule crossing time. Calibrated vertical scale is required for the inductance measurement.
•Current waveform of high loss cores will appear as a sloped line on top of a “step”. The step is due to the core loss. Ignore the step and make measurements on the sloped portion of the line as shown.
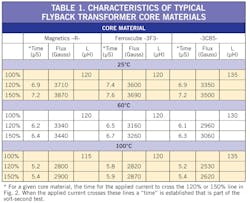
Table 1 shows testing performed on three ferrite core materials. Included in the table are the inductance for each gapped core/coil at each temperature. Measured volt-seconds are provided at 120% and 150% intersections at 25, 60 and 100 °C. The volt-second values are also converted to peak flux density. References 5and 6show test sample details.
Use of the volt-second test gives insight into the operation of the flyback core. Note that in Fig. 2 how steep the increase in current is between the 120% crossing and the 150% crossing. The time difference is only 200 ns. Beyond the 150% point, the input current increases even faster. Information gained from the volt-second test will aid the designer to anticipate the function of the transformer with a range of drive. As previously mentioned, several test methods suggest that the limit be set at the 150% point. The worst case flyback drive level should be set at or below the 120% crossing point.
The maximum design flux densities of 2,000 and 3,600 gauss cited at the beginning are, in a sense, both correct. Review of Table 1 indicates that the 3,600 gauss is the point for transformer designs limited to room or just above room temperature depending on the specific ferrite. The 2,000 gauss limit would be suitable for designs operating up to approximately 130 °C.
Designing to the maximum available flux level will produce the smallest and least expensive solution. Information provided will guide the designer to establish a suitable flux limit.
FINAL NOTES

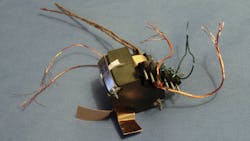
Fig. 3. Typical flyback transformer
In designing a flyback transformer such as shown in Fig. 3, keep these design tips in mind:
1)When designing a flyback transformer, the first thought might be to design the transformer to the manufacturers saturation flux density. While this would be a reasonable idea to keep the turns low and minimize “copper” losses, the approach is not workable. The manufacturers saturation test level is well beyond any useful operating point.
2)Selecting the maximum flux level for a flyback could be based on published recommendations, but there is no general agreement. The operating point (maximum flux level) must be selected with several factors in mind:
• Maximum input voltage
• Maximum “on time”
• Maximum operating temperature
• Particular ferrite type or “mix”
3)The volt- second test can be used to determine the maximum useable drive level for a given ferrite type and maximum operating temperature. Since the “result” of the volt-second test is not dependent on the applied voltage or the applied pulse width, the answer can be scaled to apply to any turns, core area, pulse width or applied voltage up to the test temperature of the particular ferrite material tested. Once a maximum flux level is set at a maximum operating temperature, an initial design can be performed. Evaluating the initial design will confirm meeting the design target. Should a target be missed, the design steps can be modified to correct the shortcoming. Knowing the worst case current simplifies the design of the current limit of the transistor switch.
4)Flyback transformer designs often have low turns. Designs with fractional turns can in some cases give the best result. Reference 7 provides information on how to design with fractional turns.
5)One final note related to flyback design- extra effort should be made to minimize leakage inductance. While leakage inductance cannot be avoided, leakage inductance wastes power and generates voltage spikes at current shutdown that may damage other components.
REFERENCES
1. Ferrites and Accessories, EPCOS AG, Edition 09/2006, ordering No. EPC: 61011-7600, Pages 149 and 156.
2. Volt-second testing was covered in MIL-T-21038D. Paragraph 4.7.12.5 on pages 29 and 30. The reference is to an obsolete version of the military standard. Currently the standard is “Performance” specification MIL-PRF-21038F. The current performance standard does not provide volt-second testing detail.
3. IEEE Standard 389-1996, Clause 16.
4. IEEE Standard 390-1987, Section 6.5.
5. Cores used were Magnetics Inc. NR-41510-UG, Ferroxcube RM5/I-3C85 and RM5/I-3F3. All cores were assembled with an approximate 3 mil gap. Note: Ferroxcube has replaced 3C85 with a lower loss 3C94.
6. Bobbin winding- Primary: 20 turns of #27, Secondary: 20 turns of #32
7. Dixon, Lloyd, “How to Design a Transformer with Fractional Turns”, Unitrode Power Supply Design Seminar, SEM-600A, Section M8
About the Author
Comment About the Article
To join the conversation, and become an exclusive member of Electronic Design, create an account today!

Leaders relevant to this article: