PDN Basics –Paralleling Tantalum and Ceramic Capacitors Can Be Risky
Tantalum capacitors provide high capacitance for a given size though they have higher ESL than ceramic and are, therefore, not the optimum choice for high frequency decoupling. The common solution is to parallel tantalum capacitors for bulk capacitance and ceramic for high frequency decoupling. A popular rule of thumb is to parallel ceramic capacitors of different values, such as 0.1 uF, 0.01 uF and 0.001 uF to provide wideband decoupling. In theory, this sounds like an ideal solution but in practice, it can lead to disastrous results.
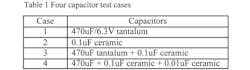
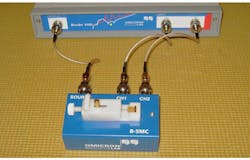
Table 1 lists lists the four cases we will use to evaluate capacitor performance. The capacitors picked are arbitrary, but the math and general solution is independent of the specific capacitors. The ESL and ESR of the 470 uF capacitor are measured using the OMICRON Lab Bode 100 in conjunction with the OMICRON Lab B-SMC impedance adapter. These are low cost general purpose tools that perform gain-phase as well as impedance measurement. Fig. 1. shows the setup for the 470 µF capacitor impedance measurement.
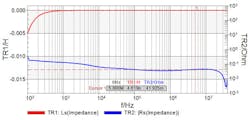
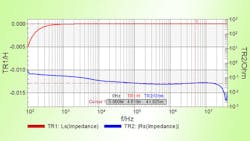
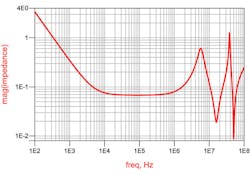
The 470 µF tantalum capacitor ESR and ESL at 5MHz are 41.9mΩ and 4.62nH respectively as seen in Fig. 2. Using the same setup, the ESR and ESL of the ceramic capacitor are measured to be 15.9mΩ and 1.29nH, respectively (Fig. 3).

Creating A Simple Model
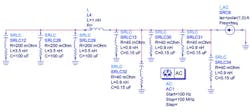
The capacitor terms are entered into a simulation file (Fig. 4). A 1.5nH connection inductance is included as an estimate for the two short traces connecting the two capacitors.
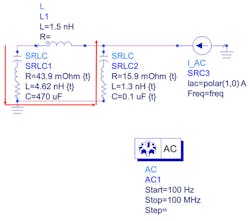
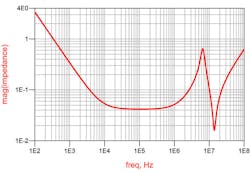
The total loop resistance identified by the red arrows in Fig. 4 results in a series resistance of 41.9mΩ+15.9mΩ = 57.8mΩ. The total loop inductance is 4.62nH+1.5nH+1.3nH = 7.42nH and since the 470µF tantalum capacitance is much greater than the 0.1uF series capacitance is approximately 0.1µF. The simulated impedance of the two parallel capacitors is shown in Fig. 5.
Measured results
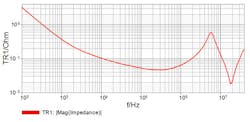
The two capacitors are then mounted to a circuit board that includes a BNC connector and pads spaced to solder the two capacitors to, as well as short interconnecting traces. Fig. 6 shows the mounted capacitors. Fig. 7 shows the measurement results.

The characteristic impedance of the resonance is calculated from the inductance and capacitance.

Where:
Z0 = Characteristic impedance in Henries
C = Capacitance in µF
Q at resonance is:

Where:
Z0 = Characteristic impedance in ohms
R = Total series resistance in ohms
Impact of ESR tolerance
The tolerance of the tantalum capacitor ESR is generally quite large. The ESR of the ceramic capacitor can vary dramatically from manufacturer to manufacturer and even between part numbers from the same manufacturer. Since the Q is a function of the total series resistance, the peak impedance is also a function of the ESR.
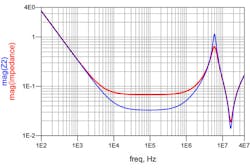
What may seem counterintuitive is that as the ESR increases the peak impedance decreases and as the ESR decreases the peak impedance increases. Simulation comparisons at the measured ESR and at half the measured ESR are shown in Fig. 8.
Adding a third, smaller capacitor
Here is where things get interesting. A smaller 0.01uF ceramic capacitor is added to the simulation model in parallel with the 0.1µF capacitor. The capacitor ESR and ESL (including the solder mount) are estimated to be 8 mΩ and 1 nH respectively. The simulation result of the three parallel capacitors is shown in Fig. 9.
The addition of a third, smaller ceramic capacitor results in a significantly increased impedance peak due to the resonance just below 40 MHz.
Managing the PDN – Interconnecting Impedance between the Regulator and its Load
1. A few simple guidelines can help manage the power distribution network (‘PDN’) impedance. This impedance is critical in order to assure that the voltage remains within the allowable limits for all of the devices being powered by the network.
2. Choose the tantalum capacitor carefully. While the tendency is to choose capacitors with very low ESR this often results in a very high Q PDN. Reducing the ESR can significantly increase the PDN peak impedance.
3. The “target” impedance is generally determined by taking the maximum allowable voltage change divided by the maximum expected current change. The current change is often assumed to be 50% of the maximum operating current.
4. A good starting point is to choose tantalum capacitors to have a total ESR of approximately 50% of the target impedance.
5. Selecting a higher working voltage generally results in a higher ESR.
6. Parallel several smaller capacitors to reduce ESL.
7. Target a maximum worst case resonant Q of 1 to 1.5. This can often be achieved by choosing capacitors carefully.
The target impedance is defined as:

We want this impedance to be as flat as possible across the entire frequency band because individual resonances can become additive. A recent article on this topic is included as a reference at the end of this article.
Since the dynamic current change is often dependent on software or user operation, the exact current demand isn’t generally known. A common rule of thumb is to allow for a dynamic current that is 50% of the maximum operating current.
Example
Assuming a switching regulator with a bandwidth of 10kHz is required to maintain a target impedance of 100mΩ up to 100MHz. The regulator’s control loop will manage the impedance below the 10kHz bandwidth while the capacitor related PDN must provide the impedance management from 10kHz to 100MHz.
Since the target impedance is 100mΩ, the starting point should be to choose bulk tantalum capacitors with an ESR of 50mΩ total. The total capacitance required to meet an impedance of 50mΩ at 10kHz is:

To minimize the ESL we select three parallel 100uF capacitors each with 200mΩ ESR such as T495C107K016ZTE200 or TPSC107K010R0200. Each capacitor is assumed to have an ESL of 3.5nH.
The frequency at which the total ESL of the three parallel capacitors that is equal to an ESR of 50mΩ is:

Selecting a ceramic capacitance that is equal to 50mΩ at 6.8MHz:

The maximum allowable ESL for 100mΩ at 100MHz is:

Assuming an ESL of 0.9nH per ceramic capacitor, this requires five parallel capacitors.
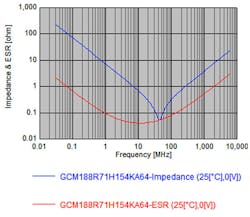
The ceramic capacitors need to be approximately 0.1uF each in order to meet the required 0.47µF total ceramic capacitance. Ideally, we would also like the ESR of the ceramic to be approximately half the target impedance of 50mΩ, though ceramic capacitors generally have much lower ESR. A 0.15µF capacitor is selected from Murata due to its relatively high ESR and moderate ESL. The selected ceramic capacitor has an ESR of approximately 40mΩ and ESL of 600pH. An additional 300pH is allowed for the solder joint. Fig. 10 shows the frequency-impedance plot of the capacitor impedance and ESR.
The three tantalum capacitors and five ceramic capacitors are simulated as shown in Fig. 11. A 1nH interconnect is assumed between the tantalum and ceramic capacitors.
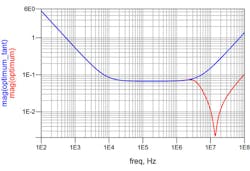
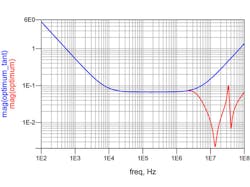
The simulation results are shown in Fig. 12. The blue trace shows the impedance of the tantalum capacitors alone while the red trace shows the impedance of the tantalum capacitors combined with the ceramic capacitors. The impedance below 10kHz is managed by the control loop. The impedance just meets the target impedance requirement at 100MHz. Additional ceramic capacitors, lower ESL capacitors or additional, smaller ceramic capacitors can be added.
Following the same procedure as for the 0.15uF ceramic capacitors, the impedance of the ESL at 68MHz reflects the goal impedance of 50mΩ. Setting ceramic capacitance for this impedance results in:

Three parallel 0.015µF capacitors, each with an ESR of 20mΩ and ESL of 1nH including the solder mount are selected and added in parallel with the three tantalum capacitors and five parallel 0.15µF capacitors. Fig. 13 shows the simulation results.
References
1. S.M. Sandler, Target impedance based solutions for PDN may not provide realistic assessment, May 2013 http://www.edn.com/design/test-and-measurement/4413192/4/Target-impedance-based-solutions-for-PDN-may-not-provide-a-realistic-assessment
About the Author
Steve Sandler
Steve Sandler is the founder and chief engineer of AEi Systems LLC and the president of Picotest. At Picotest he is responsible for signal injector product development, as well as the overall operation of the test equipment company.
Comment About the Article
To join the conversation, and become an exclusive member of Electronic Design, create an account today!

Leaders relevant to this article: