Tracing and Debugging to Increase Efficiency

This article series is in the Improving Software Code Quality topic within our Series Library
It’s no surprise to anyone that newly written software is rarely 100% bug-free. However, steps can be taken in the beginning to help reduce the number of issues that may appear in your code. Or, to put it another way, to make it so you’ll have less debugging to do. The clear starting point is laying down some basic rules for code hygiene:
- Use a coding standard like MISRA and CERT C. Striving for MISRA compliance helps avoid quite a few of the pitfalls inherent in C and C++. CERT C can add a security perspective to the list of things to avoid. The first corollary is to pay close attention to your compiler warnings. The second corollary is to use an automated static checker to check your compliance.
- Use your own, or someone else’s, hardware abstraction layer. Avoid inlining code that directly manipulates hardware in your code. For example, if you need to start a timer, call a HAL function to set up and start the timer instead of directly manipulating the timer registers. You’ll realize numerous advantages by heeding this advice, one of which is almost completely avoiding copy/paste errors and typo mistakes when dealing with several different timer invocations in different places of the code base. Moreover, a compiler can often do a better job at optimizing, and might even inline the code, so you gain in both performance and code size. A corollary to this advice is to keep the individual HAL functions as small as possible—avoid creating "Swiss Army Knives" (large functions with many responsibilities). Not only are small, single-purpose functions easier to understand and maintain, they’re also often easier for a compiler to optimize really well, which may seem a bit counterintuitive.
- Give a little extra thought to how you use memory. For example, do you really need dynamic memory management? Is the stack really a good place to store complex data structures? Standards for functional safety and high-integrity software often advise strongly against dynamic memory management and storing complex or large data structures on the stack, and these are for good reasons.
- If your toolchain supports worst-case stack depth analysis, the investment to read up on and use that functionality will pay off quickly.
To printf or Not to printf Should Not Be the Question
One of first things to realize (or remember) is that if you’re developing and debugging embedded software, you’re very likely to do so in an environment where executing code on the target is done through a debugger. For example, if you’re working in an IDE, the easiest way to execute your program is by firing up the debugger.
Let’s get down to the nitty gritty and look at the power of breakpoints. But first, let’s throw some shade at the venerable printf as a debugging tool.
The most important reason to not use printf is that adding printf-statements in your code can dramatically affect how your code is compiled. Not only is the printf a function call, but the arguments to the call will have to be accounted for. This means that stack and register usage will look completely different and many compiler optimizations will not be performed, especially if the statement is located in a tight loop.
Such a scenario can have unpredictable consequences if your code is complex or relies on C/C++ behavior that’s implementation-defined or even undefined by the C/C++ standards. What might happen is that your code behaves perfectly well when adding the printf to the code, but breaks when you remove the printout, or vice versa? By the way, this is a very good reason to strive for MISRA compliance.
Another good reason is that printf is a weak tool as it can only display data. A third reason is that to change the behavior of the printout or add more printing statements, you need to rebuild the application and download it to the target again. Finally, at some point you will have to go through the code base and remove all of the statements you added, even if they’re all guarded with #ifdefs.
The Power of Breakpoints
So, let’s take a break from the preaching and look at the different types of breakpoints available. A breakpoint, in its simplest form, is a stop sign at a particular source statement that ensures execution breaks unconditionally when reaching the right spot. A good debugger will let you examine the content of variables, registers, and the call stack as well as memory in general. Such a code breakpoint is very useful in and of itself, but it can also be associated with an expression whose truth value determines if execution stops or not.
This lets you focus on the interesting cases instead of examining the interesting variables every time execution passes through the breakpoint location. For example, if you want a closer look at what’s going on in a specific range of value in a loop index variable, you can set up the expression to stop only when the index is in that range rather than stopping each time you hit that code. Of course, you can also construct more complex stop expressions based on any variables that are in scope.
Sometimes you really need to see the value of one or more expressions. This can be done easily by using a log breakpoint—a breakpoint whose only purpose is to print a message in the debug log window without stopping execution. It’s essentially a debugger-supplied printf that can be combined with a Boolean expression to determine whether or not the message should be generated.
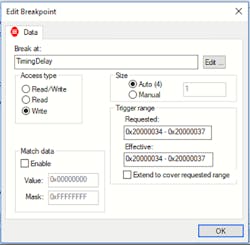
A very powerful type of breakpoint is the data breakpoint. This triggers a specific variable or a memory location is accessed. It can be extremely helpful if you’re trying to figure out why data values in a specific location aren’t what’s expected.
Why would this be needed? There can be several reasons, but one of the sources for such issues is pointers. If you use pointers, there’s a fair chance that at some point you will get some pointer arithmetic wrong. While reading from or writing to the wrong address might not make the program fail, it can produce very strange results. These kinds of issues can be very tricky to debug, as the actual bug and the place where you experience the effect often aren’t related in any way.
Combining data breakpoints (or any type of breakpoint, for that matter) with the call stack window can be very revealing (Fig. 1). The call stack window will show you where you came from. It also gives you the opportunity to move up and down the call chain and examine parameter values.
Some of these types of breakpoints may not always be available, depending on the exact device running the program, and/or the specific debug probe.
Some targets support live reading of memory, so that the debugger can continuously display variable values and other information during execution with a standard debug probe.
A Path to Enlightenment
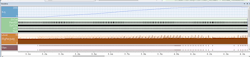
If you can stand a few extra buzzwords and adjectives, let’s talk about a debugging tool that’s truly amazing. Trace is a way to record the execution and other types of data flow on your device, like interrupt information and other hardware events (Fig. 2). For example, viewing combined event data in a timeline can be very revealing about how a system behaves: Are your interrupts firing when they should, and how does it correlate with other activity?
What makes trace more complex than regular debugging is that there are many different types of trace technologies, and different ways to access the trace data. In addition, you may need a trace-enabled probe. To utilize the power of trace in the best way means thinking about what you need to do to use it at the beginning of your project:
- One thing to consider is the choice of device. Does it have trace functionality, and if so, what kind? Is the device available in versions with and without trace? If so, you may build development versions of your board with trace and go to production without it to keep cost down.
- Trace can also be an enabler for profiling and code coverage data, so thinking upfront about your needs in that area can be beneficial.
High-quality trace tools are designed to take away the pain of trace complexity and use all available trace information, but you still need to understand your needs on the hardware side. However, investing some time and resources upfront in trace as a debug and code-quality tool will pay off when you hit that first tricky issue.
The Path to Increased Efficiency
Some of the topics in this article might seem borderline trivial, but the best solutions to tricky problems often fall into this category. Finding the root cause of a software problem can take days or even weeks, or it may be a quick and easy process. One way to reduce the difficulty is to spend a moment thinking about how to best use your knowledge of the code base in combination with the features of your debugger and trace tools, rather than always reaching for a printf statement. Over time, this way of working will boost productivity and efficiency, not to mention peace of mind.
Read more from the Improving Software Code Quality series within our Series Library
Anders Holmberg is General Manager, Embedded Development Tools, at IAR Systems.
