Know Your Safety Application Notes (Part 1): Failure Rates

What you'll learn:
- How to start predicting your system’s reliability.
- What is Arrhenius HTOL?
- What is Siemens Norm 29500?
- What is IEC Technical Report 62380: 2004?
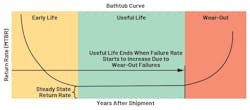
Failure rate or base failure rate refers to the number of failures per unit of time, typically in terms of failures in time (FITs) equivalent to one failure in a billion hours, which can be expected to occur for the product during its useful lifetime. Figure 1 shows the reliability bathtub curve model for failure of electronic components that can be divided into three sections: early life or infant mortality failures, useful life or constant (random) failures, and wear-out failures. Thus, this article focuses on failure rates during the useful life of the component.
Knowing the failure rates of components in electronic systems is essential in making reliability predictions to evaluate the overall system reliability. Reliability prediction involves specifying the reliability model, the failure modes to be assumed, the diagnostic intervals, and the diagnostic coverage. These predictions serve as the input to reliability modeling techniques such as failure mode and effects analysis (FMEA), reliability block diagrams (RBDs), fault tree analysis (FTA), etc.2,3
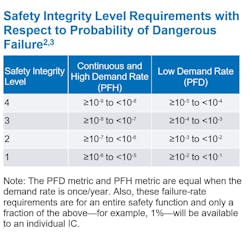
In line with functional safety, the need to predict quantitative reliability related to random hardware failures of a safety-related system against the safety integrity level (SIL) targets comes from the second part of the basic functional safety standard IEC 61508.3 It specifies the requirements for the hardware aspects of safety-related systems (SRS). Such SIL targets with respect to an SRS’s probability of dangerous failure are shown in the table.
How to Start Predicting Your System’s Reliability
Several databases exist to provide failure rates that system integrators can use when designing a system. Among the available sources of failure-rate data for electronic and non-electronic components are the IEC Technical Report 62380: 2004, Siemens Standard SN 29500, the ADI component mean-time-to-fail (MTTF) data, field returns, and expert judgment.4
The ADI component MTTF data can be found at analog.com under the Reliability section. Under Reliability Data and Resources are the wafer fabrication data, assembly/package process data, Arrhenius/FIT rate calculator, parts per million calculator, and the reliability handbook. Figure 2 shows what each resource subsection contains.

To help understand the differences between the first three cited failure-rate data sources for semiconductors—ADI component MTTF data focusing on Arrhenius high temperature operating life (HTOL), the Siemens Standard SN 29500, and the IEC TR 62380:2004—the following sections will provide some insights on each of those methods and the associated databases.5,6
What is Arrhenius HTOL?
HTOL is one of the most used accelerated life tests as defined in JEDEC standards to estimate component failure rate. HTOL testing aims to simulate device operation at elevated temperatures to provide sufficient acceleration to simulate many years of operation at ambient temperatures, typically at 55°C. Thus, HTOL estimates the long-term reliability of a semiconductor component—for example, MTTF—under accelerated stress conditions that compress the time to simulate the component’s lifespan while heating it and maintaining its operational voltages.
>>Download the PDF of this article, and check out Parts 2 and 3 of the series


Zooming into the details of reliability calculations, the data generated at the accelerated testing conditions of HTOL (1,000 hours at 125°C or equivalent) is translated to lifetimes at the end-user operating conditions (10 years at 55°C) by using the Arrhenius equation with an activation energy of 0.7 eV. The chi-squared statistical distribution is used to calculate the confidence intervals (60% and 90%) on the failure-rate data based on the number of units HTOL tested.
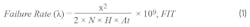
where:
- x2 is the inverse chi-squared distribution whose value depends on the number of failures and confidence interval
- N is the number of units HTOL tested
- H is the duration of HTOL testing
- At is the acceleration factor from test-to-use conditions calculated according to the Arrhenius equation
Wafer fabrication data is one of the reliability data and resources available at analog.com. Clicking it will give data that includes a product’s overall life-test data summary. This is composed of the overall sample size, quantity failing, the equivalent device hours at 55°C, the FIT values (based on HTOL data), and the MTTF data at 60% and 90% confidence levels. An example of this is shown in Figure 3.

Functional safety often requires a confidence level of 70%, so the 90% level can be conservatively used. Or it could be converted using a process such as that shown in “How to Change the Confidence Level of Your Reliability Predictions.”5
What is Siemens Norm 29500?
The SN 29500 standard is a lookup-table-based standard that was initiated by Siemens and is widely used as the basis for the reliability predictions in ISO 13849. With this, the reliability prediction is calculated through failure rates, where the failure rate is defined as the proportion of failures that can be expected on average under given environment and functional operation conditions in a time interval. This standard is recognized as representing a conservative approach to determine the component failure rates.
The reference FIT values per device category have basically been determined from field returns of the specific component class. For this reason, they would include any kind of failure type seen in the application and not only intrinsic failures as induced by the HTOL method shown in the previous section. This includes failures due to electrical overstress (EOS), which will not occur in the controlled lab environment used in HTOL testing.5-8
Equation 2 shows how the SN 29500-2 derives its failure rate for integrated circuits. First, it provides a reference failure rate that corresponds to the component failure rate under the standard-defined reference conditions. Since the reference condition will not always be the same, the standard also provides conversion models to calculate failure rates depending on stress operating conditions such as voltage, temperature, and drift sensitivity as shown in Equation 2.

where:
- λref is the failure rate under reference conditions, which scales with the number of transistors
- πU is the voltage dependence factor
- πT is the temperature dependence factor
- πD is the drift sensitivity factor
Depending on the nature of the IC, Equation 2 can vary. For example, when it’s an analog IC with an extended range of operating voltage, Equation 2 can be used. For all other analog ICs with fixed operating voltage, the voltage dependence factor will be set to 1. For digital CMOS-B families, the drift sensitivity factor will be set to 1. Lastly, both voltage dependence and drift sensitivity factors will be set to 1 for all other ICs.
Note that the IEC 617099 standard provides information on how to translate a reliability prediction from one set of conditions to another and appears to be the theory behind the SN 29500.
What is IEC Technical Report 62380: 2004?
IEC 62380 is another commonly used standard for estimating the failure rate of an IC. It was published in 2004 and subsequently replaced by the IEC 61709. Despite this, the IEC 62380 standard is still used as a reference in the automotive functional-safety standard ISO 26262:2018; it’s still available in the 11th part as a model for reliability prediction of electronic components. This standard calculates the failure rate of an IC as a sum of the die, package, and EOS. The expression of FIT calculation according to IEC TR 62380 and ISO 26262-11:2018 is shown in Equation 3.10-12

where:
- λdie is the die failure rate that contains parameters related to the number of transistors, IC’s family and technology used, and mission profile data such as temperature, working time, and influence factor of annual cycles
- λpackage is the package failure rate that contains parameters related to the thermal factor, thermal expansion, mission profile’s temperature factor of cycle, and IC’s packaging
- λoverstress is the overstress failure rate that has corresponding terms for different external interfaces
Failure Rates in ADI’s Safety Application Notes
Aside from the reliability data that can be found at analog.com, the reliability prediction of components for Analog Devices (ADI) can also be found in an IC’s safety application note, which is typically available when an IC is tagged as FS-enabled. For instance, the LTC2933's safety application note shows the part’s FIT values derived from HTOL, SN 29500, and IEC 62380 reliability prediction methods. This can be seen in Figures 4, 5, and 6.

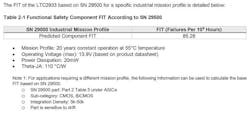
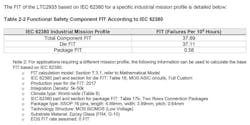
The tables shown in the figures display the FIT values alongside the conditions considered. System integrators can use available information under the tables to calculate the FIT by themselves if they have different conditions.
Conclusion
This article provides an overview of the three most common reliability prediction techniques for integrated circuits, namely the Arrhenius HTOL, SN 29500, and IEC 62380. A calculation based on the Arrhenius formula utilizing the data from HTOL testing provides the failure rate in FIT. SN 29500 offers a reference failure rate as well as conversion models to consider different stress operating conditions. IEC 62380 provides the failure rate of electronic components as the sum of the die failure rate, package failure rate, and overstress failure rates.
For ADI, failure rates of components can either be found at analog.com or in a component’s safety application note. The advantage of the safety application note is that it provides a component’s reliability predictions based on the three methods discussed. On top of this, the information needed to calculate such FIT values is made available so that system integrators can redo the calculations for themselves if they have different operating conditions.
References
1. Reliability Handbook. Analog Devices Inc.
2. David J. Smith. The Safety Critical Systems Handbook: A Straightforward Guide to Functional Safety: IEC 61508 (2010 Edition), IEC 61511 (2015 Edition) and Related Guidance. Butterworth-Heinemann, 2020.
3. “IEC 61508 All Parts, Functional Safety of Electrical/Electronic/Programmable Electronic Safety-Related Systems.” International Electrotechnical Commission, 2010.
4. “IEC 61800-5-2 Annex C, Adjustable Speed Electrical Power Drive Systems—Safety Requirements—Functional: Available Failure Rate Databases.” International Electrotechnical Commission, 2016.
5. Tom Meany. “Reliability Predictions for Integrated Circuits.” Analog Devices Inc., 2021.
6. S. Singh and S. Masade. “FIT Rate Calculations for FMEDA in ISO 26262.” ACL Digital.
7. “SN 29500 Part 2, Expected Values for Integrated Circuits.” Siemens Norm, 2010.
8. Jesus Fco. Ortiz-Yañez, Manuel Roman Pina-Monarrez, and Osvaldo Monclova-Quintana. “Reliability Prediction for Automotive Electronics.” DYNA, Vol. 91, 2024.
9. “IEC 61709, Electric Components—Reliability—Reference Conditions for Failure Rates and Stress Models for Conversion.” International Electrotechnical Commission, 2017.
10. “IEC Technical Report 62380: Reliability Data Handbook—Universal Model for Reliability Prediction of Electronics Components, PCBs and Equipment.” International Electrotechnical Commission, 2004.
11. “ISO 26262 Part 11, Road Vehicles—Functional Safety: Guidelines on Application of ISO 26262 to Semiconductors.” International Organization for Standardization, 2018.
12. Dan Butnicu. “A Review of Failure Rate Calculation’s Differences Due to Package for IEC-TR-62380 vs. Other Prediction Standards.” IEEE, 2021.
>>Download the PDF of this article, and check out Parts 2 and 3 of the series
About the Author
Bryan Angelo Borres
Senior Power Applications Engineer, Analog Devices Inc.
Bryan Angelo Borres is a TÜV-certified functional-safety engineer who currently works on several industrial functional-safety projects. As a senior power applications engineer, he helps system integrators design functionally safe power architectures that comply to industrial functional-safety standards such as the IEC 61508. Recently, he became a member of the IEC National Committee of the Philippines to IEC TC65/SC65A and IEEE Functional Safety Standards Committee. Bryan has a postgraduate diploma in power electronics and more than seven years of extensive experience in designing efficient and robust power electronics systems.
Comment About the Article
To join the conversation, and become an exclusive member of Electronic Design, create an account today!

Leaders relevant to this article: