Download this article in PDF format.
This week’s solar eclipse was the first coast-to-coast solar eclipse to travel across the United States since 1918. It lasted a short period of time, taking approximately one hour and 33 minutes to make the journey.
Back in 1918, the U.S. energy grid of course didn’t rely on solar energy. However, that’s changed dramatically. Just the past 16-plus years has seen a massive jump in total solar capacity (distribution and transmission connected) in the U.S., from 5 MW in 2000 to 42,619 MW in 2016.
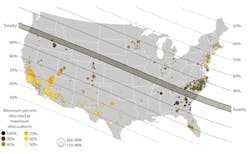
According to U.S. Energy Information Administration (EIA), the eclipse affected approximately 1,900 utility-scale solar photovoltaic (PV) power plants in the United States. However, the North American Electric Reliability Corp. (NERC) did not anticipate any reliability issues for the bulk power system, as relatively little solar PV capacity was in the “path of totality” (Fig. 1). Yet some utilities did experience a sudden increase in load that was previously being supplied by behind-the-meter photovoltaic generators.
1. This map of the U.S. plots the utility-scale solar photovoltaic generators and path of the August 21 solar eclipse. (Courtesy of EIA)
Before the event, system planners and operators began preparation and cooperation to understand how a solar eclipse could affect power flows and resources. A white paper by NERC, titled “A Wide-Area Perspective on the August 21, 2017 Total Solar Eclipse,” identified the potential effects of the eclipse on the amount of solar generation required to serve the forecasted hourly load. It shares results while providing an overview of data collection, assumptions, and test cases.
Data Collection and Assumptions
To create the case scenario for the solar-eclipse study, NERC collected data from two sources for transmission and distribution:
- ABB’s Velocity Suite database: ABB retrieved data that provided provincial- and state-specific hourly load estimates and generating-unit capacity.
- SEIA and GTM: The SEIA and GTM Research’s “US Solar Market Insight Q3 2016” report provided U.S. state total distribution-system photovoltaic (PV) installation capacity.
Several assumptions were made for the study. For example, all hourly load data was expected to be the maximum load occurring during the hour on the transmission system. Distribution-system load was believed to be already incorporated into the data. Parameters of the data collection included:
- With the exception of the Ontario province, the Canadian distribution-system PV system data wasn’t considered for the study because the eclipse path would predominantly affect the United States.
- An in-service date of August 1, 2017 was selected as a cutoff for generating all unit data. Therefore, any unit cited to be in-service prior to this date was counted toward the state’s total generating capacity. Any generating-unit status listed as canceled, retired, mothballed, or postponed was eliminated from the generating data.
- The system under study was assumed to be lossless. In addition to ignoring transmission-line losses, power transfers between Balancing Authorities were ignored. In addition, available resources within each state were perceived to be adequate to balance the loss of photovoltaic generation due to the eclipse.
- Distribution-system PV data from the GTM report was categorized as either residential customers or residential customers. The total PV was obtained from aggregating the residential MW and non-residential MW.
The hours from 9:00 am to 5:00 pm were chosen for the study to evaluate the impact of an eclipse throughout a typical workday. Photovoltaic technology was limited to facilities that solely convert sunlight into electricity. Thermal systems and supplemental or backup energy sources were not included.
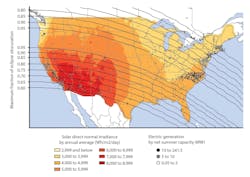
2. Shown is the direct normal irradiance, eclipse bands, and locations of transmission photovoltaic generators. (Courtesy of NERC)
In Figure 2, the eclipse-band layers are marked on the map by a series of parallel lines, and the locations of utility-scale photovoltaic systems are shown by white, gray, and black circles. The obscuration eclipse bands (eclipse levels) were created by mapping 5% increments of eclipse obscurations to Google Earth maps of North America. Looking at the map, there’s a high concentration of solar utilities in the states of California and North Carolina.
Test Cases
The data collected was used in a total of 522 scenarios. Each scenario was composed of the following components and all results were compared to the respective area’s hourly base case data:
- Forecasted hour ending August 21, 2017 (load in MW).
- Area-specific total transmission-system nameplate capacity of photovoltaic generation reduced by the time of day and by both high and low eclipse bands (two MW values)
- When applicable, the area-specific total distribution-system nameplate capacity of photovoltaic generation decreased by the time of day and highest fraction of obscuration due to the eclipse.
The study gives an example that helps to understand how to calculate base case data, which can be used to solve the problem of conservation of power:
“For example, the forecasted hourly load at 9:00 a.m. is 1,000 megawatts for an area. The area’s total transmission photovoltaic nameplate capacity is 100 megawatts, and the area’s total distribution photovoltaic nameplate capacity is 10 megawatts. The photovoltaic generation scale percentage at 9:00 a.m. is 40 percent. Thus, the total photovoltaic generation is (100+10)*0.4 = 44 MW. Therefore, the base case data for the area is 1,000 MW – 44MW = 956 MW. The eclipse scenarios (low and high band) for 9:00 a.m. would then be compared to this base case data point.”
Results
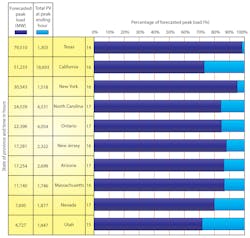
The top 10 states with the greatest amount of total system PV nameplate capacities were plotted in Figure 3. The top four states that required advanced system coordination prior to the eclipse were Utah, California, Nevada, and North Carolina. The peak load is forecasted for Utah at the ending hour of 3:00 p.m. (Mountain) and Nevada at 5:00 p.m. (Pacific).
3. The chart compares the top 10 states and provinces with photovoltaic nameplate capacities versus the respective August 21, 2017 forecasted hour ending non-coincident peak load. (Courtesy of NERC)
Provided that the eclipse occurred at the projected peak period, then the ramp rate for a five-minute interval would be difficult to control without standby energy-storage systems. But the actual time of the eclipse in Utah was 10:13 am and Nevada is 10:00 a.m. Therefore, it didn’t affect Utah at all. Utah had a maximum obscuration of 0.95; Nevada and North Carolina experienced a total eclipse.
Utah’s peak load in comparison to the magnitude of the projected peak load for California differs by 166.2%. Utah’s load was expected to increase by approximately 24% for the high-band eclipse scenario and 22% for the low-band eclipse scenario. The portion of the 4,727-MW load projected for the peak would then need to be served by other resources. This wasn’t a major concern, as there are sufficient synchronous resources in Utah to serve its respective load. Specifically, it was expected that Utah will have 8,787 MW (nameplate) of non-photovoltaic resources installed and operational by August 1, 2017.
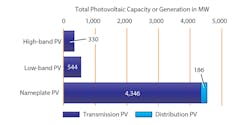
Similar statements and comparisons about the load size can be applied to North Carolina, which experienced total obscuration (100%) in some parts of the state. It’s interesting to see how in North Carolina (Fig. 4), the low-band eclipse scenario yields 87% reduction in transmission-system nameplate capacity. In contrast, the high-band eclipse scenario gives a 92% reduction in transmission nameplate capacity. For both scenarios, there’s a 100% reduction in distribution-system nameplate capacity because North Carolina was in the path of total obscuration of the sun. The utilities in North Carolina needed to compensate the loads during total obscuration.
4. Projections are given for North Carolina’s PV generation for high-band PV and low-band PV scenarios in comparison to the total installed nameplate capacity. (Courtesy of NERC)
Conclusions
Studies like the one from NERC can help maintain a reliable bulk power system during predictable events like a solar eclipse. Even though the increase in load was not extreme, advanced actions to avoid balancing issues can be done based on these types of studies. The U.S. will have another total solar eclipse in 2024, and the effects on the power system will be different as more storage technologies become installed, and thus need to be included in any analysis. New generation units will be more efficient, so it will likely be necessary to recognize the variation in efficiency between components due to technical advances.
About the Author
Maria Guerra
Power/Analog Editor
Maria Guerra is the Power/Analog Editor for Electronic Design. She is an Electrical Engineer with an MSEE from NYU Tandon School of Engineering. She has a very solid engineering background and extensive experience with technical documentation and writing. Before joining Electronic Design, she was an Electrical Engineer for Kellogg, Brown & Root Ltd (London. U.K.). During her years in the Oil and Gas Industry she was involved in a range of projects for both offshore and onshore designs. Her technical and soft skills bring a practical, hands-on approach to the Electronic Design team.
