Can I Power My Device with an Energy Harvester?
What you’ll learn:
- How to determine if your IoT application can be powered by energy harvesting.
- A step-by-step process to guide the evaluation.
In the IoT arena, the power consumption of wireless devices continues to fall. At the same time, the efficiency of energy-harvesting systems continues to rise in small increments. As such, there are a growing number of instances where primary batteries can be eliminated or substituted by a secondary battery that acts as the energy-storage reservoir.
The attractions of energy harvesting for wireless IoT devices, notably sensors, include reducing their lifetime operating cost and eliminating battery waste, with the subsequent environmental benefits that this brings.
Of course, every use case is different. The duty cycles of devices, the availability of harvestable energy, the characteristics of the devices themselves, the wireless communications protocol selected, and the environments in which they operate all affect the peak and average power consumption of devices.
However, the methodology for assessing the opportunity to power a device with energy harvesting is basically the same: Measure your device’s energy consumption, measure the output of your energy harvesting system, optimize both, and size the energy-harvesting system for the use case.
The following example illustrates the three-step process. Qoitech’s Otii tools were used for this study, but the same principles would apply when using comparable test equipment.
LoRaWAN Device Case Study Using the GNSE from The Things Industries
For our case study, we decided to use a multifunctional hardware platform for building LoRaWAN IoT nodes called the Generic Node Sensor Edition (GNSE), which is offered by The Things Industries. LoRa chipsets were chosen as they’re the most popular for LPWAN IoT applications, according to data from Beecham Research (Fig. 1).
We opted for the GNSE based on STMicroelectronics’ STM32WL55CCU6. This is a dual-core system-on-chip comprising an integrated MCU and LoRa radio. The hardware design files and software were obtained from The Things Industries GitHub repository.
The spreading factor (SF) of a LPWAN signal is expressed as a rating between 7 and 12. Lower spreading factors mean faster chirps and therefore a higher data-transmission rate. For every increase in spreading factor, the chirp sweep rate is halved, and therefore the data-transmission rate is halved. Each incremental increase in SF increases the link budget by about 2.5 dB. A free online tool called LoRaTools can be used to calculate the on-air time for a given SF, bandwidth, and other parameters.
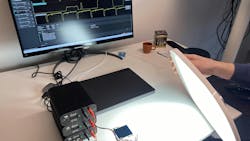
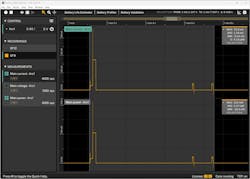
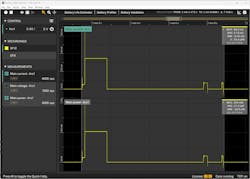
For this experiment, the Generic Node board was connected to the Otii Arc Pro analyzer. We compared results when operating at SF9 and SF12 (Figs. 2 and 3).
At SF9, the energy consumption was 6.19 µWh in active mode and 52.1 nWh in sleep for 30 seconds. At SF12, the energy consumption in active mode was far higher—35.4 µWh—but in sleep mode it was identical to the SF9 condition. The choice of SF therefore has a substantial impact on system energy requirements and energy-harvesting viability.
Making Energy-Harvester Measurements
Solar energy is still by far the most common and the most efficient to harvest, so we selected two solar energy-harvesting modules from SparkFun for this evaluation.
The first was the COM-16356, which delivers 0.08 mA at 2.9 V and is designed for low-light and indoor applications. It can be used at light levels from 200 lux upwards. The second was the 330-mW, 2.84-V, PRT-18723 solar cell.
Both were tested in a “window condition,” placed close to the window one afternoon with a clear sky but no direct sunlight, and in a “lab condition,” where the panels were one meter away from the window but closer to a ceiling-mounted fluorescent lamp. The natural light coming through the window was that available in Sweden during the winter; its intensity wasn’t measured.
The I-V curves and power curves were plotted for each harvester under each condition and the maximum power produced by each harvester condition was measured.
Calculating the Fit Between Harvester and Device
To understand whether the harvesters could power the Generic Node board, we started by making four assumptions:
- The device is always in SF9 or SF12 mode.
- 100% of the harvester’s energy is available.
- There’s no leakage in the energy-storage device, which would be a battery or capacitor.
- The light condition is constant.
In the deployed use case, these assumptions are unlikely to all be valid, but the calculation gives us a base point from which to work before adjusting the figures. In addition, the same process could be carried out in the actual operating environment, whereby changes would likely be the most significant factor in the assessment. The goal is to ensure that the energy generated by the harvester is greater than the energy consumed by the device.
The power available from each solar harvester depends principally on the incident light level and the temperature at which it’s operating. “Pmpp” is the maximum power that can be generated by the harvester. The energy from the harvester is the product of Pmpp and time.
As an approximation of device energy requirements, we only need to consider the power consumed in active mode. This is because the power consumption in sleep mode is so low, compared to the active, as to not be significant in this calculation.
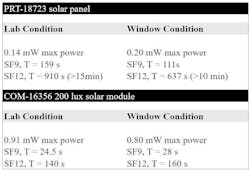
Taking the lowest-performing example of those in the table, which is the PRT-18723 solar panel in the laboratory condition, 0.14 mW of Pmpp is generated.
The Generic Node board consumes 6.29 µWh at SF9 and 35.4 µWh at SF12.
From this data, only a simple calculation is needed to estimate the ratio of device sleep to active time that can be supported by the energy-harvesting system (Fig. 4).
Read more articles in the TechXchanges: Sustainable Electronics, Low-Power Battery Technology, and Wireless IoT Technology.
About the Author

Björn Rosqvist
Chief Product Officer, Qoitech
Björn Rosqvist, co-founder of Qoitech, is a hardware engineer with 20+ years of experience in power electronics, automotive, and telecom (ABB, Volvo Cars, Ericsson, Flatfrog, Sony). He specializes in the low-power design of battery-driven embedded devices. Björn holds M.Sc. in Applied Physics & Electrical Engineering.


