Communications Test Tools: A Study of the Cassini-Huygens Mission
Smeds discovered that, while the communications system worked fine in static testing, it would fail when Huygens separated from Cassini because the planned relative velocities between the two would render the communications link inoperative. The issue at hand, Doppler shift, was well known, but until recently, practical electrical testing was not readily available.
We can learn a great deal about Doppler shift and the tools available to communications system developers by recreating critical parts of the Cassini-Huygens mission using today’s innovations in simulation and test. In this way, we can highlight the subtle, yet key, aspects of Doppler shift and how Smeds’ discovery could have been easily missed given the state of available test tools more than a decade ago.
The first challenge in recreating the Cassini-Huygens mission is calculating and visualizing the multi-year mission’s path to Saturn. While the software was available to engineers designing the mission, it was specialized and custom built.
Today’s engineers have access to very powerful off-the-shelf, physics-compliant, dynamic analytical software. For this recreation, I used Satellite Tool Kit (STK) Simulation Software from Analytical Graphics, Inc. (AGI) to visualize and model the mission’s conditions.
It is important to note that I am not an aerospace engineer. I point this out because, like many engineers specializing in other areas, I need the data generated by such software to perform my job. It is the availability and usability of STK software that have allowed me to accurately model the Cassini-Huygens mission.
Once a mock-up of the mission’s circumstances was modeled and understood, I then coupled the data output by STK to a new class of test instrument called a channel simulator. The T400CS Channel Simulator from RT Logic uses modeling data to recreate, in a physics-compliant way, the electrical perturbations that this unique transmitter-receiver pair experienced in January 2005. The end result is an illustration of how, even with a clear understanding of Doppler effects (for example, the designers used Doppler to measure atmospheric conditions on Titan), it actually was the subtle differences between carrier Doppler and signal Doppler that brought on potential disaster.
Doppler Primer
Many people understand the concept of Doppler—the common reference is to the sound of a train whistle as it passes by a listener. As the train approaches, the pitch is higher than expected; as it moves away, it is lower than expected.
Doppler shift also is a key consideration when designing any RF communications system in which the transmitter and receiver will be in motion relative to one another. For example, if I were traveling at 54 km/hour toward an FM transmitter and wanted to listen to my favorite hypothetical radio station, 100.000000 FM, I would find that it no longer is located at 100 MHz because the Doppler shift would raise the carrier frequency by 5 Hz based on Equation 1. If I had an old analog tuner, I would simply move it up in frequency to 100.000005 MHz, and the signal would be locked in. This retuning handles the condition referred to as carrier Doppler.
Equation 1 describes Doppler shift based on the actual transmitted frequency and relative velocity between the transmitter and receiver:
Fs = Fa x V/c (1)
where: Fs = Doppler shift in hertz
Fa = actual transmitted frequency in hertz
V = relative velocity between transmitter and receiver (km/s)
c = speed of light (~300,000 km/s)
Carrier Doppler was well recognized and accounted for by the Cassini-Huygens communications system’s designers. How the signal itself would be affected by the distortions created by Doppler shift was not.
To understand this difference, let’s refer back to the music playing in our hypothetical FM listening example. While we adjusted for carrier Doppler and tuned the receiver to correctly receive the carrier signal, what about Doppler shift on the information being carried? In this case, the music. The retuning of our radio compensated for carrier Doppler, but the music also is, in turn, being impacted by Doppler. The notes would all be slightly sharp using the nomenclature of music. In other words, they would all be shifted a little higher in frequency than expected.
What is even more interesting is that every frequency of the music would be affected differently, the low-frequency notes being the least sharp and the highest frequency notes the most sharp. While in practice these changes are imperceptible for an FM audio signal at automotive speeds, the impacts can be much larger and more profound for today’s digital communications systems.
When a digitally modulated signal is impacted by Doppler, the result can be much more catastrophic than notes becoming a little flat or sharp: The link can completely stop functioning due to carrier Doppler and/or signal Doppler.
This all brings us back to Smeds’ realization that the impact of signal Doppler not being accounted for jeopardized a once-in-a-lifetime mission. His discovery put in motion an amazing array of engineering heroics, resulting in a successful mission. It also has driven advancements in simulation and test tools used to guarantee the proper operation of mission-critical communications links.
Mission Modeling Overview
Whether communications systems are located in space between a spacecraft and a probe or on earth between a firefighting crew and base operations, assuring correct operation is critical. Today, engineers have many more tools available to help them ensure all aspects of missions involving transmitters and receivers in motion. To better illustrate these tools, we will recreate the Cassini-Huygens mission.
The first step is to model the mission. In this case, the actual flight path data for the NASA mission is freely available from a website supported by the “Navigation Node” of NASA’s Planetary Data System, the Navigation and Ancillary Information Facility (NAIF). This data can be imported into the STK simulation software to recreate the mission as it was on Jan. 14, 2005.
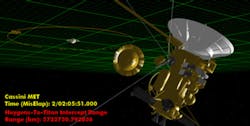
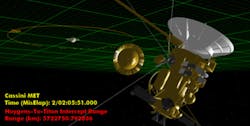
We also can model the critical descent and landing phases of the Huygens probe’s historic trip to Titan’s surface. A depiction of the planned vs. actual range rates between the Cassini and Huygens probe post-impact is shown in Figure 1. The craft labeled Cassini is in actual position at 11:33:00 Universal Time, Coordinated (UTC), and the point labeled Cassini_Planned represents where the craft might have been based on the original flight plan.

Along with the visualization shown in Figure 1 are all the physics-compliant mathematical models necessary to accurately assess the mission’s variables. The array of variables and detail available in these models is extensive. The resulting model allows engineers to consider everything from the effects of solar winds to the radiation pattern of the antenna on the probe. Engineers can even execute recursive algorithms, running thousands of alternatives to best optimize the mission.
With the Cassini-Huygens mission, engineers had to balance making minimum adjustments to the flight path to conserve fuel and obtain the best fly-by position to keep Doppler frequency shift within the communications system’s operating parameters. The resulting solution that saved the mission has to make any engineer smile with pride. For this recreation, we have the benefit of using their final solution.
Overview of the Critical Communications Phase
A large number of variables have to be considered when designing an RF communications link and even a larger number when those links will be in motion relative to each other. Noise, oscillator stability, link budget, antenna performance, Doppler shift, multipath, delay, fading, interference, signal-to-noise ratio, modulation type, data density, and power are just a few of the design parameters to be considered.
Today’s simulation and test tools can handle a wide variety of these variables with ever increasing correlation to the real-world impacts they will have on a communications link. As a way of highlighting just a few of the simulation and test capabilities available, I will focus on the key problem of signal Doppler as seen during the critical communications phase of the Huygens probe’s decent through Titan’s atmosphere and eventual landing on Titan.
The original mission would have had Cassini flying closely by Titan at an altitude of 1,200 km. While this makes good sense from the perspective of maximizing signal levels, the original flight path also maximized the frequency deviation caused by Doppler shift.
To understand this better, we will consider the static case of the Huygens probe on the surface of Titan. If the original path of Cassini is simplified into a straight line toward or away from Titan, most of the craft’s velocity is along the same path as the communications link. In other words, most of Cassini’s approximately 6 km/second velocity would all translate into relative velocity between the two craft, subjecting the link to worst-case Doppler shift during most of the mission’s critical communications phase.
Using Equation 1, and assuming the two craft are moving apart, we see that the Doppler frequency shift on the 2-GHz, S-band signal transmitted by Huygens would be approximately 40 kHz lower in frequency when received by Cassini. This amount of carrier shift was accounted for in the receiver design and posed no problem to communications, but Doppler also affects the 8-kb/s binary phase-shift keying (BPSK) signal that occupies approximately 10 kHz of bandwidth, as shown in Figure 2.
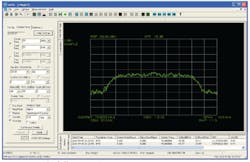
Figure 2. Spectrum Plot of 8-kb/s BPSK Signal
Much like our previous hypothetical FM signal example, all frequency content of the BPSK signal is affected by Doppler as well. Again using Equation 1, now substituting in the signal excursion, we see that the BPSK signal is as much as 200 mHz lower in frequency than expected. For a system that may be looking for data recovery stability in parts per million, this can be catastrophic if unplanned.
Figure 3 illustrates Doppler’s impact on the signal and data. Observe that the BPSK signal is stretched due to Doppler shift. This results in the receiver seeing a lower bit rate than originally transmitted.
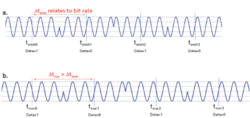
Figure 3. Doppler Shift Impact on BPSK Data
a. BPSK transmitter signal
b. BPSK transmitter moving away from receiver, where received bit rate is slower than transmitted rate
When Smeds uncovered this problem 10 years ago, Cassini-Huygens was millions of miles away. Worse yet, the system could not be remotely reconfigured to account for signal Doppler shift.
While multiple changes to the mission were put into place to ensure the communications link would operate correctly, I will focus on the changes that affected the relative velocities and, therefore, the Doppler. Instead of Cassini using the original plan involving a Titan fly-by altitude of 1,200 km, the geometry of the mission was changed. Adjustments were made to minimize Doppler shift by having Cassini pass by Titan and the Huygens probe 60,000 km away. Even though the velocity of Cassini was exactly the same as it would have been according to the original mission plan, the relative velocity was now less by the cosine of a much larger angle than the original planned angle between the velocity and communications link.
With the new mission plan, the relative velocity between the two craft was constrained to approximately half that of the original planned mission. Now, instead of an angle of near zero degrees between the velocity vector and the communications link, the angle was kept within 25 degrees of 90 degrees (straight above Huygens) for the mission’s critical communications phase. Remember, this relationship between the velocity and relative velocity is cosine based. For example, the relative velocity—therefore, Doppler shift—is zero the instant any object passes tangentially above a fixed communications point.
Figure 4 illustrates the comparison of Doppler shift. The blue line represents a reconstruction of the approximate Doppler frequency shift of the originally planned mission. The red line is the Doppler shift as received by Cassini based on flight-path information from the actual mission. Note that the Doppler shift experienced during the critical communications phases of the mission was greatly reduced when compared to the Doppler shift of the planned mission.
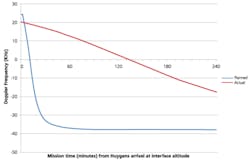
Figure 4. Cassini-Huygens Doppler Profile Original Plan vs. Final
While carrier Doppler shift is accounted for in the receiver design, there is a proportional reduction in signal Doppler. It was this subsequent reduction in signal Doppler shift that was critical to the radio link’s proper operation.
Also of note is the reduced rate of change in Doppler shift as seen in the reduced slope of the red line labeled Actual. While not mentioned as an issue for the Cassini-Huygens radio link, the rate of change of Doppler shift also can be an important factor to consider.
Pulling It All Together
Once engineers have adequately simulated the conditions and design parameters, the challenge quickly moves to building and testing the final system. During the design phase, engineers typically perform static testing in an attempt to exercise some worst-case conditions found during the simulation phase.
While this static testing is necessary, it can be difficult to recreate many of the conditions communications systems in motion will be exposed to. Recreating these effects in a phase-continuous, physics-compliant, real-time way has been difficult short of actually moving the receiver or transmitter.
This is where the new class of test equipment—channel simulators—takes over. They bench-test relative motion effects on communications hardware. Doing this in a physics-compliant and phase-continuous way is a capability only recently available. It results from advances in A-D, DSP processing, and D-A technologies, allowing channel simulators to pass through communications signals, adding only effects that would be found in the actual communications link.
Now that we have a model of the conditions that the Cassini-Huygens mission would experience, along with some understanding of their possible impact, we can pull this information together and expose candidate communications systems to the mission’s conditions. The data created through simulations now can be coupled with a channel simulator to actually model conditions that the receiver on Cassini experienced as Huygens descended and landed on Titan.
Figure 5 illustrates the STK simulation and T400CS Channel Simulator running together to reproduce the physical conditions of the Huygens mission. The image was captured at 11:38 UTC, the moment at which Huygens landed on Titan’s surface.
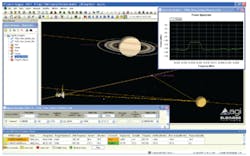
Figure 5. Channel Simulator Real-Time Programming Utilizing STK Plug-in
The STK simulation feeds data in real time (approximately three hours of critical mission time on Jan. 14, 2005) to the channel simulator which, in turn, recreates physically accurate perturbations experienced by the Cassini-Huygens communications link. A signal generator in the channel simulator is configured to transmit the 8-kb/s BPSK signal (mid left panel) similar to what Huygens would have transmitted on its decent and landing on Titan. The transmitted signal then passes through the channel simulator, but as it does, it is perturbed in a phase continuous, physics-compliant way according to the conditions that existed during the mission.
The instantaneous settings passing from the STK software simulation and programming the channel simulator are seen in the T400CS Channel Simulator Monitor (lower bottom panel in Figure 5). The receiver in this case is a spectrum analyzer (upper right panel in Figure 5) built into the channel simulator, allowing us to examine the signal from Cassini’s perspective. You can see the received BPSK signal is shifted in frequency just as Cassini would have received the signal.
If we had access to the transmitter-receiver pair that flew on the Cassini-Huygens mission, they could be substituted into the test in place of the signal generator and signal analyzer used in this illustration, thereby submitting the pair to the conditions experienced near Saturn, all while sitting on a test bench in Colorado.
Conclusion
While all the math and knowledge to correctly plan and execute the original design and, in turn, the recovery plan that ultimately saved the mission, were in place at the time, the capabilities were not productized in a way that was accessible to most engineers. Today, tools such as RT Logic’s channel simulator and AGI’s STK Simulation Software give designers the ability to optimize and test complex mission scenarios with off-the-shelf commercial tools.
While the communications designs of today may never face the same design challenges of their predecessors, there is a lesson to be learned from history: There is no substitute for the insight that can be gained from testing in environments that accurately simulate the expected real-world conditions. Hopefully, the advent of new and more powerful tools will never diminish the level of efficacy seen from the engineering community, but will only enhance it.
Acknowledgements
Overview of the Descent and Landing of the Huygens Probe on Titan, Nature Publishing Group, December 2005; Huygens Radio Link In-Flight Performance, Third International Planetary Probe Workshop, July 2005. Special thanks to Dr. Kenneth Boyer, chairman of the science department at Woodland Park High School, Woodland Park, CO; and Marc A. Hoffman, an aerospace systems engineer, at Analytical Graphics.
About the Author
Mark Lombardi is the project manager for the T400CS Channel Simulator at RT Logic. He has more than 20 years of test and measurement experience, including management of a wide range of Hewlett-Packard and Agilent Technologies product lines covering applications spanning DC to microwaves. RT Logic, 12515 Academy Ridge View, Colorado Springs, CO 80921, 719-598-2801, e-mail: [email protected].
Published June, 2010
About the Author
Comment About the Article
To join the conversation, and become an exclusive member of Electronic Design, create an account today!

Leaders relevant to this article: