How to Model Statistical Tolerance Analysis for Complex Circuits Using LTspice (Download)
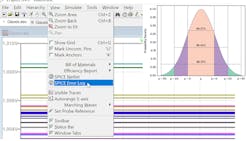
LTspice can be utilized to perform statistical tolerance analysis for complex circuits. To show the efficacy of the method, this article presents a voltage regulation example circuit modeled in LTspice, demonstrating Monte Carlo and Gaussian distribution techniques for the internal voltage reference and feedback resistors. The results of this simulation are compared to a worst-case analysis simulation.
Included are four appendices: Appendix A provides insights on the distribution of trimmed voltage references. Appendix B offers an analysis of the Gaussian distribution in LTspice. Appendix C provides a graphical view of the Monte Carlo distribution as defined by LTspice. Appendix D lays out instructions for editing LTspice schematics and extracting the simulated data.
