Measure Self-Discharge Using OCV on Lithium-Ion Cells
Download this article in PDF format.
One characteristic of lithium-ion cells is a phenomenon called self-discharge. The concept of self-discharge is simple: Take a cell, charge it up, measure its open-circuit voltage (OCV), and let it stand with nothing connected to it. Come back to the cell some time later and you will find the cell has a lower OCV, indicating that the cell is at a lower state of charge (SoC). If the SoC is lower, that means the amount of stored energy (i.e., stored Amp*Hours) in the cell is lower.
The loss of stored energy wasn’t caused by an external load (such as a light bulb or motor), but rather by self-discharge, where the energy was lost as a tiny amount of heat to an internal load inside the cell. This self-discharge, which is sometimes called leakage, reduced the SoC and ultimately reduced OCV. Note that self-discharge is a continuous process, constantly draining the cell and reducing the SoC and OCV.
The amount of self-discharge depends on many factors: cell materials/chemistry, SoC of the cell, temperature of the cell, and capacity of the cell. Generally, self-discharge is on the order of microamps. Small cells of 100 mAH might exhibit less than 10 µA of self-discharge while large cells of 100 AH might exhibit 500 µA of self-discharge.
Discovering the Self-Discharge
It’s important for engineers who design battery-powered devices powered by lithium-ion cells to know the expected self-discharge. If the battery-powered device will be stored for a long time, such as an emergency defibrillator, the designer must be able to predict when the cells will have self-discharged to the point where they will be no longer able to support a life-saving event.
If the battery-powered device is an electric vehicle, the designer will want to build a battery management system (BMS) that very accurately knows the SoC of the battery in order to deliver that maximum range to the driver. If the cells are losing SoC due to self-discharge, this loss needs to be factored into range calculations. Furthermore, if self-discharge is important to engineers making battery-powered devices, then it’s also important to cell makers—they must supply this info to their customers, who are the engineers designing battery-powered devices.
Measuring self-discharge is also rather simple in concept (Fig. 1). Using a voltmeter, measure the OCV (call it OCV1) of the cell. Then, after waiting some time (call this T), measure the OCV again (call that OCV2). The difference between OCV1-OCV2 allows you to determine the amount of SoC change. The longer the difference in time T between OCV1 and OCV2, the larger the change in SoC because it has been permitted to self-discharge for a longer amount of time.
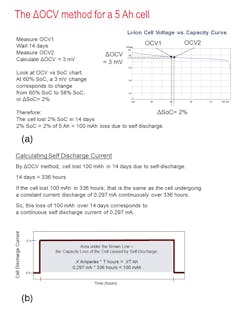
1. Step by step description of Delta-OCV method, which includes the measurement method (a), and calculating the equivalent self-discharge current (b).
To determine the self-discharge, you first determine the SoC of the cell by looking where OCV1 falls on the cell’s OCV vs. SoC curve. Call this SoC1. Then, you look at OCV2, which will tell you the new SoC. Call that SoC2. The change in SoC = SoC1-SoC2. This change in SoC will be a small number, measured in Amp*Hours (SoC is measured in Amp*Hours). The change in SoC divided by the time T between measurements will be the self-discharge current.
Delta-OCV Method
The challenges in using this method, called the Delta-OCV method, include accounting for cell relaxation and voltmeter measurement error. Another consideration is that OCV will change due to temperature—this topic will be reserved for a future article, as it has the lowest impact on the Delta-OCV measurement method.
Cell relaxation (resulting from charging or discharging) is another characteristic of the lithium-ion cell. To charge the cell, you use a charger to apply an external voltage that’s higher than the OCV of the cell. The applied external voltage charges the cell by forcing current into the cell, increasing its SoC and therefore its OCV. When you stop charging the cell and remove the external charge voltage, the cell OCV drops slightly as the cell relaxes.
Conversely, to discharge the cell, you use a discharger to apply an external voltage that’s lower than the OCV of the cell. This discharges the cell by drawing current from the cell, lowering its SoC and, therefore, its OCV. When you stop discharging the cell and remove the external discharge voltage, the cell OCV rises slightly at the cell relaxes.
The Delta-OCV method uses the change in OCV to determine self-discharge and fundamentally assumes all of the change in OCV is caused by self-discharge. However, OCV can also change due to cell relaxation as just described. Therefore, to ensure a good Delta-OCV measurement, you must wait until the cell is done relaxing before making the first OCV measurement. If you don’t wait long enough, the change in OCV will be the sum of the effects of cell relaxation and self-discharge, causing the calculation of self-discharge current to be wrong.
A Relaxed State
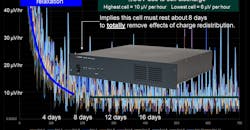
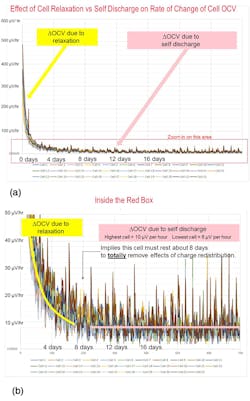
The challenge is to know how long to wait for the cell to become fully relaxed. This needs to be characterized to be certain. During the first few minutes or hours after charge or discharge, the cell may experience several hundred millivolts of OCV change (Fig. 2). This will interfere with a self-discharge measurement. It could take 10 days for a cell to fully relax and have no change in OCV from relaxation.
A rule of thumb to determine how long to wait would be to compare the expected change in OCV due to self-discharge to the change in OCV due to relaxation. If you expect 3 mV of change in OCV due to self-discharge, then you should wait until the change in OCV due to relaxation is down to 30 µV, or 1% of the expected OCV change due to self-discharge value. This could take a day or more. The specific relaxation time is determined through characterization performed by logging its OCV vs. time immediately following a charge or discharge operation. Then look at when the change in OCV is small enough to say the cell is done relaxing (aka sufficiently rested).
Pinpointing Good and Bad Cells
Now that we know how to make a self-discharge measurement using the Delta-OCV method, can we use this method to find good cells with low self-discharge and weed out bad cells with high self-discharge?
In the example used above, the Delta-OCV due to self-discharge was 3 mV. Bad cells would measure above 3 mV and good cells would be 3 mV or less. This means that the measurement accuracy requirement isn’t only to accurately measure 3 mV, but to be able to accurately measure the difference between a little more than 3 mV and a little less than 3 mV. Let’s look at an example.
For a 2.4-AH 18650 cylindrical cell, at 80% SoC, we let a good cell rest for eight days. We then measured the change in OCV vs. time, which was 10.4 mV per month, or 431 µV per day. This corresponded to a change of 0.0288 AH per month, or 1.15% SoC per month. The equivalent self-discharge current is 40 µA (= 0.0288 AH/720 hours). We performed a Delta-OCV measurement for seven days, resulting in a change of 3 mV.
We made the same measurements on a bad cell with approximately 100 µA of self-discharge. In this case, the Delta-OCV measurement was 4.3 mV.
The measurement challenge here is that we’re trying to measure very small changes (a few millivolts) on a large number (4.1 V). So, to measure the OCV, a voltmeter needs to be on a large-enough range to measure 4.1 V. Typically, this will be a 5- or 10-V range, depending on the voltmeter’s ranges. So, while it may seem easy for a voltmeter to distinguish between 3 mV and 4.3 mV, to do this accurately on a 10-V range may not be so simple.
A handheld DMM will have around 1 or 2 mV of measurement error when measuring 4 V. This means the handheld DMM isn’t accurate enough to measure the 3-mV Delta-OCV and certainly not accurate enough to accurately observe the 1.3 mV difference between the good and bad cell.
Turning to much more accurate benchtop DMMs, a 6.5-digit DMM will have about 200 µV of error while a 7.5-digit DMM will have about 100 µV of error when measuring 4 V. While this is certainly accurate enough to measure the Delta-OCV of the 4-V cell, it’s still marginal to definitively observe the difference between the good and bad cell.
Though these DMMs are used today for Delta-OCV measurements, you should not place too much confidence in their ability to classify or grade cells based self-discharge values. What’s needed is to utilize long wait times (such as 14 or more days). That will enable the cells to discharge more, resulting in higher change in SoC and a larger difference in OCV between different grades of cells.
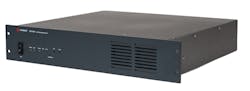
3. The Keysight BT2152A Self-Discharge Analyzer requires less than one hour to directly measure the self-discharge current of lithium-ion cells, thus eliminating the need to wait days or weeks for a change in the cell OCV.
In summary, determining self-discharge is conceptually easy as it involves just making two OCV measurements. But it’s necessary to consider relaxation and voltmeter accuracy if your goal is to grade cells based on their self-discharge value. While Delta-OCV is a trusted method, there are newer methods, such as direct measurement of self-discharge current using a Self-Discharge Analyzer (Fig. 3), which doesn’t rely on OCV measurements to determine the self-discharge current.

About the Author

Bob Zollo
Solution Architect for Battery Testing, Electronic Industrial Solutions Group
Bob Zollo is solution architect for battery testing for energy and automotive solutions in the Electronic Industrial Solutions Group of Keysight Technologies. Bob has been with Keysight since 1984 and holds a degree in electrical engineering from Stevens Institute of Technology, Hoboken, N.J. He can be contacted at [email protected].
Comment About the Article
To join the conversation, and become an exclusive member of Electronic Design, create an account today!

Leaders relevant to this article: