Use Bode Plots to Meet Dynamic-Control-Behavior Requirements
Members can download this article in PDF format.
What you'll learn:
- How to read Bode plots to assess dynamic control behavior of a power-supply design.
- Observing Bode plots from an example voltage regulator to observe control-loop speed and stability.
This article will describe how Bode plots can be leveraged as a tool to quickly assess if your power-supply design will meet the requirements for dynamic control behavior. Power supplies normally maintain a fixed output voltage via a control loop. This control loop may be stable or unstable. It also can regulate rapidly or slowly. In most cases, the control loop can be described via a Bode plot. With it, you’re able to immediately see the speed of the control loop and especially the stability of its regulation.
Figure 1 shows a typical switching regulator with a step-down (buck) topology. It converts a higher input voltage to a lower output voltage. The goal is to regulate the output voltage (VOUT) as precisely as possible. For this, a control loop is integrated into the circuit through the feedback (FB) pin. It detects voltage changes at VOUT. The control loop should respond quickly so that VOUT is always re-regulated as accurately as possible. The output voltage must be readjusted whenever the input voltage or the load current changes.
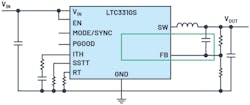
Figure 2 shows the gain curve for the control loop in a Bode plot. It yields two important pieces of information. The frequency at which the gain is equal to 1—that is, at 0 dB—can be read. For the control loop in Figure 2, this so-called crossover frequency occurs at approximately 80 kHz. As a rule of thumb, this frequency should be no more than one-tenth of the set switching frequency of the switch-mode power supply. Unstable behavior can result if this rule is violated.
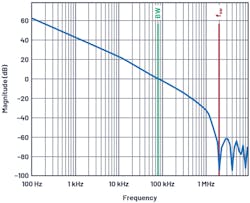
The second main piece of information shown is the area under the gain curve—the integral of the function. The higher the dc gain and the crossover frequency, the better the control loop can maintain the output voltage at a constant level.
Figure 3 shows the phase curve in a Bode plot. The most important value that can be read from this plot is the phase margin. This is a value that provides an indication of the stability of the control loop. The phase margin can be read at the crossover frequency obtained from the gain plot (Fig. 2, again). In the example shown, the crossover point lies at 80 kHz. Therefore, the phase margin in Figure 3 is approximately 60°. Phase margins of less than approximately 40° are considered unstable.
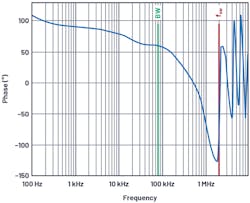
The control loop is optimally set when the phase margin is between 40° and 70°. There’s a good compromise between fast regulation and good stability in this range. Above a phase margin of 70°, systems tend to be very stable but with extremely slow regulation.
Bode plots are usually not provided in datasheets for switching regulators because the plots depend too strongly on the circuit design. The switching frequency used, the choice of external components—e.g., the inductor and the output capacitor—and the respective operating conditions—e.g., input voltage, output voltage, and load current—can have significant effects. For this reason, Bode plots often are generated using computational tools such as LTpowerCAD or with simulation tools like LTspice. With them, you can quickly find out whether a planned circuit can meet the requirements for dynamic control behavior.
About the Author

Frederik Dostal
Power-Management Technical Expert
Frederik Dostal is a power-management expert with more than 20 years of experience in this industry. After his studies of microelectronics at the University of Erlangen, Germany, he joined National Semiconductor in 2001, where he worked as a field applications engineer, gaining a lot of experience in implementing power-management solutions in customer projects. During his time at National, he also spent four years in Phoenix, Arizona (USA), working on switch-mode power supplies as an applications engineer.
In 2009, he joined Analog Devices, where since then he held a variety of positions working for the product line and European technical support, and currently brings in his broad design and application knowledge as a power-management expert. Frederik works in the ADI office in Munich, Germany.
Also check out my:
Comment About the Article
To join the conversation, and become an exclusive member of Electronic Design, create an account today!

Leaders relevant to this article: