A Bode Diagram to Display a Control Loop
What you'll learn:
- The importance of using a Bode plot to evaluate the control loop of a power supply.
- What a Bode plot can bring to light about a power supply that’s not possible with simple load transient tests.
- How to use a Bode plot to measure the speed of a control loop and the stability of a power supply.

A power supply is supposed to generate a stable, regulated output voltage. To make sure it does, the output voltage can be measured at different load currents and different input voltages. Then, the results would be looked at to determine whether the output voltage is within a desired tolerance range.
Such a basic check is an important part of designing a power supply, but it only shows part of the truth. If the load current (or supply voltage) changes during operation, the voltage generated should be maintained as well as possible. By displaying the transfer function of a power-supply loop, a Bode plot can fill in the gaps. While there are load-transient tests in the time domain, the results don’t show other important information that’s provided by a Bode plot.
>>Download the PDF of this article

Power Supplies Face Fluctuating Load Currents and Input Voltages
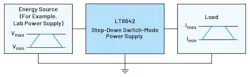
Figure 1 shows a block diagram of a power supply (the LT8642S) with a load transient and input voltage changes. For dynamic evaluation of a power supply, the output voltage generated can be checked at different load transients and different input voltage changes.
Typically, the output voltage under different conditions is displayed on a curve (Fig. 2). The load current at the output of the power supply is changed from 1 A to 7 A current, within a 500-ns transition time. The load transient can be seen in red. The output voltage curve is shown in blue.
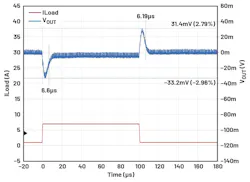
As illustrated, the output voltage generated drops by 33.2 mV with a positive load transient at time zero. The control loop of the power supply then manages to stabilize the output voltage again after about 10 μs. At the time of 100 μs, a load transient from 7 A back to 1 A load current is made, as seen in Figure 2. The output voltage shows a short overshoot to a value that is about 31.4 mV above the nominal output voltage.
Evaluating a power-supply control loop this way is useful, and it offers a lot of insight into control behavior. However, these load-transient measurements are often insufficient.
For example, it can be difficult to get a clear sense of whether the behavior of the output voltage curve is mainly determined by the size of the output capacitance, or by the speed of the control-loop transfer function. A slow control loop can be partly compensated for with additional output capacitors.
Also, a load transient test doesn’t provide clear information about the stability of a control loop. A measurement, as shown in Figure 2, can come from a control loop, which is barely stable and slips into instability with a slight parameter change. This can be caused by the tolerance range of components, temperature effects, and slightly altered operating conditions. Then, the output voltage generated would no longer be kept at a fixed value. Instead, the output voltage would oscillate with a large amplitude.
However, the voltage curve in Figure 2 can also come from a power supply that offers a high stability margin. Here, slight changes in the circuit, as outlined above, would not lead to an oscillation.
The Benefits of a Bode Diagram
Figure 3 shows a Bode diagram of the power supply from Figure 1. Here, the speed of the control loop is visible from the point at which the gain (the red curve) crosses the 0-dB line. The higher the crossover frequency, the faster the control loop. Usually, a 0-dB crossover frequency between one-tenth and one-fifth of the switching frequency is targeted.
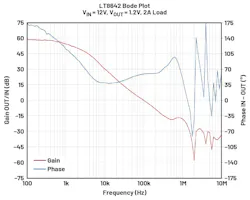
A crossover frequency of about 100 kHz is shown in Figure 3. In addition to this frequency, DC gain (the gain at low frequencies) also has an influence on the speed of the control loop. The higher this gain, the faster the control loop appears.
In addition, a Bode diagram lends insight into the stability margin of a power supply. At the frequency of the 0-dB crossover, the phase offset, also known as the phase margin, can be seen in the blue curve. In the example, this phase margin is about 59°. A phase margin greater than 45° is considered to be stable.
Neither the speed of a control loop nor the stability of a power supply can be figured out directly through a load-transient test alone. Consequently, Bode plots provide vital information about the behavior of a control loop.
>>Download the PDF of this article
About the Author

Frederik Dostal
Power-Management Technical Expert
Frederik Dostal is a power-management expert with more than 20 years of experience in this industry. After his studies of microelectronics at the University of Erlangen, Germany, he joined National Semiconductor in 2001, where he worked as a field applications engineer, gaining a lot of experience in implementing power-management solutions in customer projects. During his time at National, he also spent four years in Phoenix, Arizona (USA), working on switch-mode power supplies as an applications engineer.
In 2009, he joined Analog Devices, where since then he held a variety of positions working for the product line and European technical support, and currently brings in his broad design and application knowledge as a power-management expert. Frederik works in the ADI office in Munich, Germany.
Also check out my:
Comment About the Article
To join the conversation, and become an exclusive member of Electronic Design, create an account today!

Leaders relevant to this article: